Performance analysis, tools and experimentsPosted on by mev
My Ryzen 9 AI hx 370 system was repeatedly crashing the display. The system would still be up but dmesg told me there were cpu lockups.
Looking at Phoronix reviews of the HX 370 it suggested their laptop also saw these crashes and they updated to a newer version of the Linux kernel and Mesa graphics. So I found this page which described the “mainline” package for retrieving and picking up kernels.
That worked well until I tried “perf” and it didn’t find a perf package for my kernel. So learned another trick. If you type “sudo apt install linux-tools-” and then a tab it will try to autocomplete. More usefully it will give you a list of available tools. Once that set of perf tools is installed, I then went to do the same thing but “sudo apt install linux-image-” and picked the corresponding kernel.
No to update mesa, I found this page which gave me the instructions for getting the latest Mesa drivers. With both installed, I now will see if this helps my kernel/driver crashes.
Performance analysis, tools and experimentsPosted on by mev
As a follow up to previous posting looking at Ryzen AI HX 370, I have also done some SPEC CPU2017 experiments. My general idea is to compare the two processors with a few caveats:
I have used a configuration file roughly based on AMD Server configuration files and using the AMD AOCC compiler. However, because I am not trying to publish the absolute best results for hardware (and haven’t tuned to do so) – I will report relative comparison results rather than absolute numbers.
I expect AMD to release a new version of AMD AOCC for the Zen5 core. I didn’t have it when I did these comparisons and like using the same flags on both systems so these comparisons used the same flags for both Zen4 and Zen5 systems.
SPEC CPU2017 guidelines give a requirement of 2 GB of memory per core. My Ryzen 370 system has 24 cores and only 32 GB of memory. So I expect some benchmarks might run out of memory. For this reason and trying to get an overall comparison I’ve thus done two runs:
A 16-copy run on both systems. This uses all (hyperthreaded) cores on the Ryzen 7840 HS and a mix of hyperthreading of Zen5 cores + non-hyperthreading of Zen5C cores.
A 24-copy run on the Ryzen 370 system.
Relative results are shown in the tables below. This gives me some opportunities to drill a little deeper on why some benchmarks have larger gains than others.
Overall the differences between 16 threads and 24 threads are interesting. Using 24 threads seems to mostly help the intrate benchmarks with the geomean going from +12% to +21% and every benchmark improving vs 7840. Overall, using 24 threads seems to be more mixed with fprate. On average slightly slower than 16-threads. In both cases, the individual benchmarks also differ.
16-thread
24-thread
500.perlbench_r
1.12
1.24
502.gcc_r
1.17
1.15
505.mcf_r
1.09
1.21
520.omnetpp_r
1.07
1.16
523.xalancbmk_r
1.35
1.23
525.x264_r
1.19
1.31
531.deepsjeng_r
1.11
1.18
541.leela_r
0.94
1.07
548.exchange_r
1.24
1.38
557.xz_r
0.96
1.16
geomean
1.12
1.21
My intrate comparisons range from -6% to +35% with a geometric mean of +12%
16-thread
24-thread
503.bwaves_r
1.11
1.09
507.cactuBSSN_r
1.30
1.25
508.namd_r
1.22
1.34
510.parest_r
1.53
1.10
511.povray_r
1.19
1.30
519.lbm_r
1.63
1.59
521.wrf_r
1.32
1.17
526.blender_r
1.24
1.27
527.cam4_r
1.61
1.45
538.imagick_r
1.19
1.32
544.nab_r
1.19
1.31
549.fotonik_r
1.11
1.09
554.roms_r
1.43
1.15
geomean
1.30
1.26
My fprate comparisons range from +11% to +63% with a geometric mean of +30%
Agner Fog architecture document and likwid-topology
lmbench
L1 – 0.8 ns
L2 – 3 ns
L3 – 8 ns
L1 – 0.8 ns
L2 – 3ns
L3 – 8 ns
Measured in Nanoseconds
Graphics
Radeon 780M
12 cores
2700 MHz
Radeon 890M
16 cores
2900 MHz
Phoronix stream
Average: 40604 MB/s
Average 44500 MB/s
Phoronix coremark
Average 464076 Iterations/second
Average 563477 Iterations/second
+21%
Following are the results from likwid-topology. This is a hybrid core with four Zen5 cores and eight Zen5c cores. I believe the first four cores are Zen5 and the remaining eight are Zen5c.
The L3 cache amount may be incorrect as specifications suggest 24 MB of cache. Using lmbench suggests the L3 cache attached to first four cores is 16MB and the next groups have 8MB likely together even though topology above makes them separate.
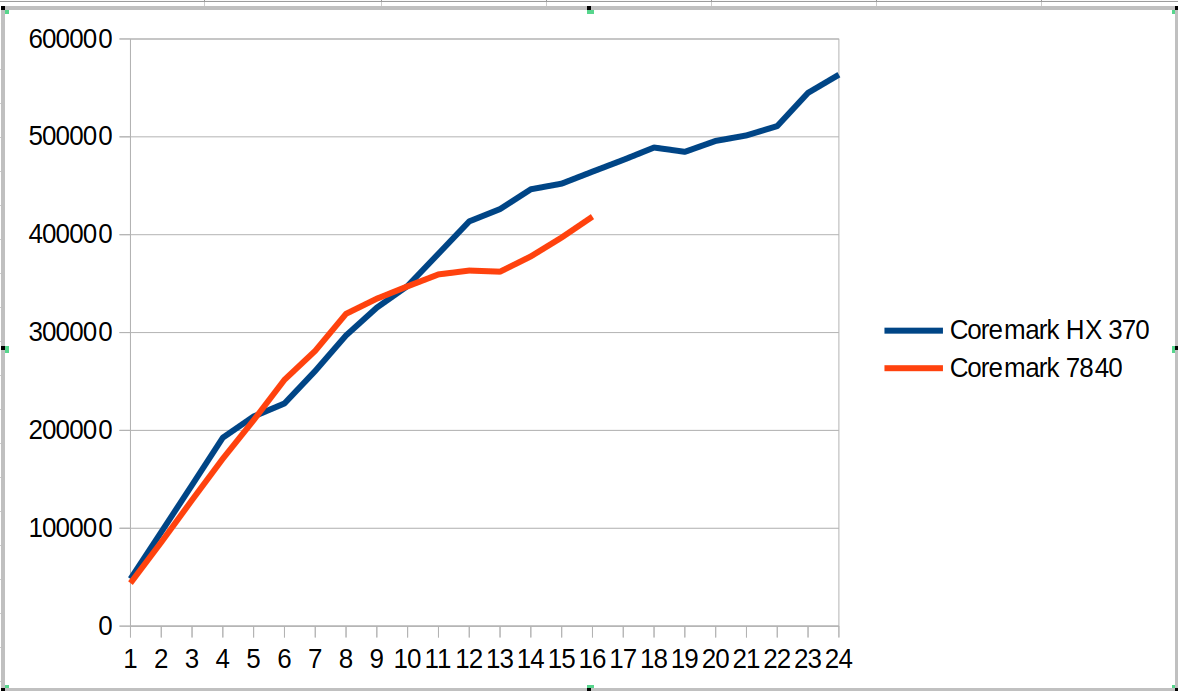
This hybrid SOC shows up in the following coremark scaling comparison as shown in the graph below. There are several different regions
From 1 to 4 cores we compare Zen4 cores against Zen5 cores. The coremark value for 4 cores is ~12% ahead.
From 5 to 8 cores, we now have Zen5 + Zen5C cores against Zen4 cores. The coremark value for 8 cores is ~7% behind
From 9 to 12 cores, we use all the cores on HX 370 and start using SMT for the 7840. The coremark value for 12 cores is 6% ahead
From 13 to 16 cores we go to using SMT for all the Zen5 cores and not-SMT for Zen5C cores. The 7840 moves to fully SMT. The coremark value for 16 cores is 11% ahead
From 17 to 24 cores, we go to adding SMT for Zen5C cores. The overall coremark using all cores (24 vs 16) is 21% ahead.
This suggests for coremark and other workloads there will be different regions where combinations of SMT and Zen5 vs Zen5C cores will create interesting comparisons between the systems.
The tabular version of coremark including performance counters is shown below.
Cores
Coremark HX 370
Coremark 7840
Scaling HX 370
Scaling 7840
Retiring HX 370
Frontend HX 370
Backend HX 370
Speculation HX 370
SMT-contention HX 370
Retiring 7840
Frontend 7840
Backend 7840
Speculation 7840
SMT-contention 7840
1
48245
43881
100%
100%
44.2%
25.2%
62.0%
2.0%
0.0%
43.9%
12.4%
43.0%
0.7%
0.0%
2
96106
85758
100%
98%
44.0%
25.5%
61.8%
2.0%
0.0%
43.9%
12.4%
43.1%
0.7%
0.0%
3
144147
128841
100%
98%
44.0%
25.5%
61.8%
2.0%
0.0%
43.6%
13.0%
42.7%
0.7%
0.0%
4
192537
171061
100%
97%
44.1%
25.4%
61.9%
2.0%
0.0%
43.9%
12.3%
43.1%
0.7%
0.0%
5
214223
210368
89%
96%
44.0%
25.5%
61.8%
2.0%
0.0%
43.9%
12.3%
43.1%
0.7%
0.0%
6
227532
251705
79%
96%
44.0%
25.4%
61.9%
2.0%
0.0%
43.2%
12.9%
43.2%
0.7%
0.0%
7
260811
281369
77%
92%
44.0%
25.7%
61.7%
2.0%
0.0%
43.3%
12.2%
43.7%
0.7%
0.0%
8
297002
319098
77%
91%
44.1%
25.3%
61.9%
2.0%
0.0%
42.7%
12.8%
43.8%
0.7%
0.0%
9
325417
334602
75%
85%
44.1%
25.3%
62.0%
2.0%
0.0%
40.2%
15.9%
36.3%
0.6%
7.1%
10
347636
347246
72%
79%
44.0%
25.3%
61.9%
2.0%
0.0%
38.4%
17.8%
30.2%
0.5%
13.1%
11
380587
359402
72%
74%
44.0%
25.5%
61.8%
2.0%
0.0%
36.9%
19.6%
25.3%
0.5%
17.8%
12
413575
363288
71%
69%
44.0%
25.4%
61.9%
2.0%
0.0%
35.5%
21.1%
21.6%
0.4%
21.3%
13
426123
362144
68%
63%
42.1%
28.2%
52.9%
1.8%
8.3%
34.4%
22.4%
18.5%
0.4%
24.3%
14
446379
377767
66%
61%
40.5%
30.6%
45.6%
1.6%
15.1%
33.1%
24.4%
15.2%
0.4%
26.9%
15
452134
397145
62%
60%
39.5%
32.2%
40.6%
1.4%
19.7%
32.2%
25.3%
12.0%
0.3%
30.2%
16
464431
418462
60%
60%
38.3%
33.7%
35.8%
1.3%
24.2%
31.1%
26.0%
9.5%
0.3%
33.1%
17
476416
58%
37.9%
34.4%
33.5%
1.2%
26.3%
18
489001
56%
37.2%
35.0%
31.2%
1.2%
28.7%
19
484655
53%
36.6%
35.4%
29.2%
1.1%
30.9%
20
495826
51%
36.5%
36.5%
26.3%
1.0%
33.1%
21
501457
49%
35.7%
37.3%
23.9%
1.0%
35.5%
22
510946
48%
35.1%
37.7%
22.0%
0.9%
37.6%
23
544895
49%
34.7%
38.5%
19.5%
0.8%
39.8%
24
563477
49%
34.0%
38.2%
19.4%
0.8%
40.9%
I also measured stream and it looks ~15% faster than my 7840 system.
-------------------------------------------------------------
STREAM version $Revision: 5.10 $
-------------------------------------------------------------
This system uses 8 bytes per array element.
-------------------------------------------------------------
Array size = 100000000 (elements), Offset = 0 (elements)
Memory per array = 762.9 MiB (= 0.7 GiB).
Total memory required = 2288.8 MiB (= 2.2 GiB).
Each kernel will be executed 100 times.
 The *best* time for each kernel (excluding the first iteration)
 will be used to compute the reported bandwidth.
-------------------------------------------------------------
Number of Threads requested = 2
Number of Threads counted = 2
-------------------------------------------------------------
Your clock granularity/precision appears to be 1 microseconds.
Each test below will take on the order of 31409 microseconds.
   (= 31409 clock ticks)
Increase the size of the arrays if this shows that
you are not getting at least 20 clock ticks per test.
-------------------------------------------------------------
WARNING -- The above is only a rough guideline.
For best results, please be sure you know the
precision of your system timer.
-------------------------------------------------------------
Function    Best Rate MB/s  Avg time     Min time     Max time
Copy:           86725.2     0.018665     0.018449     0.021070
Scale:          86626.7     0.018713     0.018470     0.020643
Add:            88192.8     0.027540     0.027213     0.031095
Triad:          87655.3     0.027729     0.027380     0.031028
-------------------------------------------------------------
Solution Validates: avg error less than 1.000000e-13 on all three arrays
-------------------------------------------------------------
Here is a phoronix article comparing Ryzen AI 9 HX 370 with a variety of laptop systems. The overall geomean is ~10% but there is a wider variety between tests. Can be interesting to puzzle out why some of the differences. It is also likely that the power points used for the laptop comparisons in the phoronix article are less since I see lower scores e.g. coremark or different gaps than what I see with the same benchmark. So will need to puzzle out some of the SOC/power choices.
Performance analysis, tools and experimentsPosted on by mev
Zen5 mobile processors have been released. I had ordered an ASUS Zenbook S16 laptop with Ryzen 9 AI 365 processor and it arrived today. Full tech specifications are at the link but include: So far I have only run Windows …Continue reading →
Performance analysis, tools and experimentsPosted on by mev
I have set up a new Intel performance machine for experiments. The processor is a i5-13500H in a Geekom MiniIT13 mini-PC. Following are some of the major parameters. This comparison is with Ryzen 7840 which will be my AMD comparison …Continue reading →
Performance analysis, tools and experimentsPosted on by mev
I have set up a new AMD performance machine for experiments. The processors is a Ryzen 7840 (Phoenix) in a Beelink SER7 mini-PC. Following are some of the major parameters. This comparison is with Intel i5-13500H which will be my …Continue reading →
Performance analysis, tools and experimentsPosted on by mev
From past work, we know the five counters required to compute the first level topdown metrics on Intel processors: CLK_UNHALTED_CORE = 0x00 IDQ_UOPS_NOT_DELIVERED_CORE = 0x9C, umask=1 UOPS_RETIRED_RETIRE_SLOTS = 0xC2, umask=2 UOPS_ISSUED_ANY = 0x0E, umask=1 INT_MISC_RECOVERY_CYCLES = 0x0d, umask=3, cmask=1 These …Continue reading →