Performance analysis, tools and experimentsPosted on by mev
Installing and reinstalling Operating Systems can be easier to do if I maintain several virtual machines with each configuration. While this lets me compare VMs and OSs against each other, there is also a question on how the virtual environment compares against the host environment. So I’ve created a few configurations I can use for these comparisons. In particular:
Name
Threads
Memory
Notes
boulder
16
32GB
Host: 7840HS, Zen4; ubuntu 24.04
niwot
24
32GB
Host: RX 370, Zen5; ubuntu 24.04
boulder-ubuntu
8
16GB
ubuntu 24.04 guest
boulder-cachyos
8
16GB
cachyos guest
boulder “constrainted”
8
32 GB
host with taskset –cpulist
niwot-ubuntu
12
16GB
ubuntu 24.04 guest
niwot-cachyos
12
16GB
cachyos guest
niwot “constrained”
12
32GB
host with taskset –cpulist
Since I can’t dedicate the entire machine to the VM, I instead bind the VM to run with one thread bound per (hyper-threaded host) core. I also define half the memory. I can then compare this against a host “constrained” configuration that also runs on those same cores, e.g.
The first benchmark I pick for such a comparison is coremark.
Name
Threads
Score
boulder
16
412415
niwot
24
563857
boulder-ubuntu
8
296640
boulder-cachyos
8
310674
boulder “constrained”
8
317576
niwot-ubuntu
12
356810
niwot-cachyos
12
369503
niwot “constrained”
12
401518
First thing to note is that the 7840 “constrained” configuration runs at 77% of the full host configuration (317576/412415) while the 370 “constrained” configuration runs at 71% (401518/563857) so running half the cores isn’t quite as large for the 370.
Next thing to notice is the Ubuntu virtual machine performance of 7840 is 93% of constrained while 370 is 88% of constrained. The net effect is the host only benchmark is 1.37x faster on 370 than 7840 but the virtual machine is only 1.20x faster. CachyOS is faster and hence it is 98% of host on 7840 and 93% of host on 370.
This is only one benchmark so will also be useful to cross-check how much these trends also apply to other workloads. I can probably also separate this to see how much the “constrained” matches the full system and then see what the virtualization overhead as two separate comparisons.
Agner Fog architecture document and likwid-topology
lmbench
L1 – 0.8 ns
L2 – 3 ns
L3 – 8 ns
L1 – 0.8 ns
L2 – 3ns
L3 – 8 ns
Measured in Nanoseconds
Graphics
Radeon 780M
12 cores
2700 MHz
Radeon 890M
16 cores
2900 MHz
Phoronix stream
Average: 40604 MB/s
Average 44500 MB/s
Phoronix coremark
Average 464076 Iterations/second
Average 563477 Iterations/second
+21%
Following are the results from likwid-topology. This is a hybrid core with four Zen5 cores and eight Zen5c cores. I believe the first four cores are Zen5 and the remaining eight are Zen5c.
The L3 cache amount may be incorrect as specifications suggest 24 MB of cache. Using lmbench suggests the L3 cache attached to first four cores is 16MB and the next groups have 8MB likely together even though topology above makes them separate.
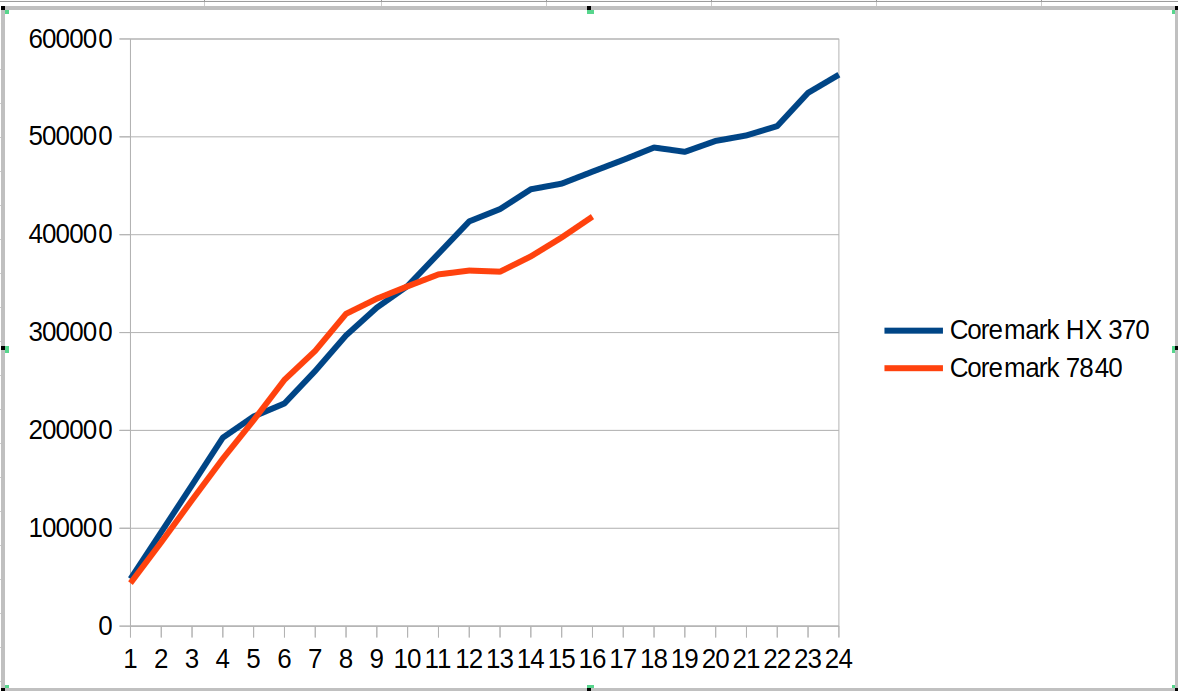
This hybrid SOC shows up in the following coremark scaling comparison as shown in the graph below. There are several different regions
From 1 to 4 cores we compare Zen4 cores against Zen5 cores. The coremark value for 4 cores is ~12% ahead.
From 5 to 8 cores, we now have Zen5 + Zen5C cores against Zen4 cores. The coremark value for 8 cores is ~7% behind
From 9 to 12 cores, we use all the cores on HX 370 and start using SMT for the 7840. The coremark value for 12 cores is 6% ahead
From 13 to 16 cores we go to using SMT for all the Zen5 cores and not-SMT for Zen5C cores. The 7840 moves to fully SMT. The coremark value for 16 cores is 11% ahead
From 17 to 24 cores, we go to adding SMT for Zen5C cores. The overall coremark using all cores (24 vs 16) is 21% ahead.
This suggests for coremark and other workloads there will be different regions where combinations of SMT and Zen5 vs Zen5C cores will create interesting comparisons between the systems.
The tabular version of coremark including performance counters is shown below.
Cores
Coremark HX 370
Coremark 7840
Scaling HX 370
Scaling 7840
Retiring HX 370
Frontend HX 370
Backend HX 370
Speculation HX 370
SMT-contention HX 370
Retiring 7840
Frontend 7840
Backend 7840
Speculation 7840
SMT-contention 7840
1
48245
43881
100%
100%
44.2%
25.2%
62.0%
2.0%
0.0%
43.9%
12.4%
43.0%
0.7%
0.0%
2
96106
85758
100%
98%
44.0%
25.5%
61.8%
2.0%
0.0%
43.9%
12.4%
43.1%
0.7%
0.0%
3
144147
128841
100%
98%
44.0%
25.5%
61.8%
2.0%
0.0%
43.6%
13.0%
42.7%
0.7%
0.0%
4
192537
171061
100%
97%
44.1%
25.4%
61.9%
2.0%
0.0%
43.9%
12.3%
43.1%
0.7%
0.0%
5
214223
210368
89%
96%
44.0%
25.5%
61.8%
2.0%
0.0%
43.9%
12.3%
43.1%
0.7%
0.0%
6
227532
251705
79%
96%
44.0%
25.4%
61.9%
2.0%
0.0%
43.2%
12.9%
43.2%
0.7%
0.0%
7
260811
281369
77%
92%
44.0%
25.7%
61.7%
2.0%
0.0%
43.3%
12.2%
43.7%
0.7%
0.0%
8
297002
319098
77%
91%
44.1%
25.3%
61.9%
2.0%
0.0%
42.7%
12.8%
43.8%
0.7%
0.0%
9
325417
334602
75%
85%
44.1%
25.3%
62.0%
2.0%
0.0%
40.2%
15.9%
36.3%
0.6%
7.1%
10
347636
347246
72%
79%
44.0%
25.3%
61.9%
2.0%
0.0%
38.4%
17.8%
30.2%
0.5%
13.1%
11
380587
359402
72%
74%
44.0%
25.5%
61.8%
2.0%
0.0%
36.9%
19.6%
25.3%
0.5%
17.8%
12
413575
363288
71%
69%
44.0%
25.4%
61.9%
2.0%
0.0%
35.5%
21.1%
21.6%
0.4%
21.3%
13
426123
362144
68%
63%
42.1%
28.2%
52.9%
1.8%
8.3%
34.4%
22.4%
18.5%
0.4%
24.3%
14
446379
377767
66%
61%
40.5%
30.6%
45.6%
1.6%
15.1%
33.1%
24.4%
15.2%
0.4%
26.9%
15
452134
397145
62%
60%
39.5%
32.2%
40.6%
1.4%
19.7%
32.2%
25.3%
12.0%
0.3%
30.2%
16
464431
418462
60%
60%
38.3%
33.7%
35.8%
1.3%
24.2%
31.1%
26.0%
9.5%
0.3%
33.1%
17
476416
58%
37.9%
34.4%
33.5%
1.2%
26.3%
18
489001
56%
37.2%
35.0%
31.2%
1.2%
28.7%
19
484655
53%
36.6%
35.4%
29.2%
1.1%
30.9%
20
495826
51%
36.5%
36.5%
26.3%
1.0%
33.1%
21
501457
49%
35.7%
37.3%
23.9%
1.0%
35.5%
22
510946
48%
35.1%
37.7%
22.0%
0.9%
37.6%
23
544895
49%
34.7%
38.5%
19.5%
0.8%
39.8%
24
563477
49%
34.0%
38.2%
19.4%
0.8%
40.9%
I also measured stream and it looks ~15% faster than my 7840 system.
-------------------------------------------------------------
STREAM version $Revision: 5.10 $
-------------------------------------------------------------
This system uses 8 bytes per array element.
-------------------------------------------------------------
Array size = 100000000 (elements), Offset = 0 (elements)
Memory per array = 762.9 MiB (= 0.7 GiB).
Total memory required = 2288.8 MiB (= 2.2 GiB).
Each kernel will be executed 100 times.
 The *best* time for each kernel (excluding the first iteration)
 will be used to compute the reported bandwidth.
-------------------------------------------------------------
Number of Threads requested = 2
Number of Threads counted = 2
-------------------------------------------------------------
Your clock granularity/precision appears to be 1 microseconds.
Each test below will take on the order of 31409 microseconds.
   (= 31409 clock ticks)
Increase the size of the arrays if this shows that
you are not getting at least 20 clock ticks per test.
-------------------------------------------------------------
WARNING -- The above is only a rough guideline.
For best results, please be sure you know the
precision of your system timer.
-------------------------------------------------------------
Function    Best Rate MB/s  Avg time     Min time     Max time
Copy:           86725.2     0.018665     0.018449     0.021070
Scale:          86626.7     0.018713     0.018470     0.020643
Add:            88192.8     0.027540     0.027213     0.031095
Triad:          87655.3     0.027729     0.027380     0.031028
-------------------------------------------------------------
Solution Validates: avg error less than 1.000000e-13 on all three arrays
-------------------------------------------------------------
Here is a phoronix article comparing Ryzen AI 9 HX 370 with a variety of laptop systems. The overall geomean is ~10% but there is a wider variety between tests. Can be interesting to puzzle out why some of the differences. It is also likely that the power points used for the laptop comparisons in the phoronix article are less since I see lower scores e.g. coremark or different gaps than what I see with the same benchmark. So will need to puzzle out some of the SOC/power choices.
Performance analysis, tools and experimentsPosted on by mev
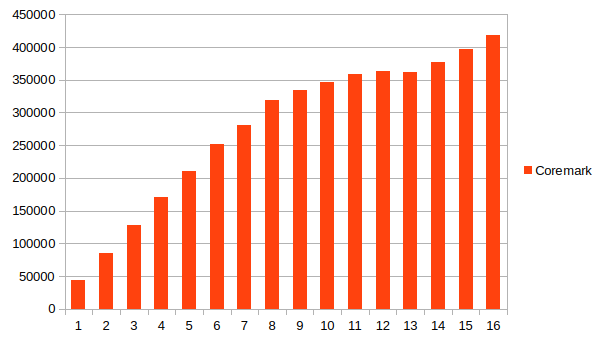
The following chart shows the Phoronix test suite coremark value when running from 1 to 16 cores.
Cores
Coremark
Scaling
Retiring
Frontend
Backend
Speculation
SMT-contention
1
43881
100%
43.9%
12.4%
43.0%
0.7%
0.0%
2
85758
98%
43.9%
12.4%
43.1%
0.7%
0.0%
3
128841
98%
43.6%
13.0%
42.7%
0.7%
0.0%
4
171061
97%
43.9%
12.3%
43.1%
0.7%
0.0%
5
210368
96%
43.9%
12.3%
43.1%
0.7%
0.0%
6
251705
96%
43.2%
12.9%
43.2%
0.7%
0.0%
7
281369
92%
43.3%
12.2%
43.7%
0.7%
0.0%
8
319098
91%
42.7%
12.8%
43.8%
0.7%
0.0%
9
334602
85%
40.2%
15.9%
36.3%
0.6%
7.1%
10
347246
79%
38.4%
17.8%
30.2%
0.5%
13.1%
11
359402
74%
36.9%
19.6%
25.3%
0.5%
17.8%
12
363288
69%
35.5%
21.1%
21.6%
0.4%
21.3%
13
362144
63%
34.4%
22.4%
18.5%
0.4%
24.3%
14
377767
61%
33.1%
24.4%
15.2%
0.4%
26.9%
15
397145
60%
32.2%
25.3%
12.0%
0.3%
30.2%
16
418462
60%
31.1%
26.0%
9.5%
0.3%
33.1%
Graphically it looks as follows
The question is what causes the inflection points on the graph? The scaling from 1-8 cores decreases only slightly and my guess is the inflection point after this happens because of SMT contention. What is interesting is the second inflection point where for the first few additional SMT cores we decline but then settle in after that to become asymptotic to ~60% scaling.
Looking at the topdown performance counter profiles gives two general trends
As hyper-threaded cores are used, the amount of SMT contention goes up. This is somewhat expected for this workload with moderately high retirement rate. One limiter is is that the core is busy with the other thread.
The workload shifts from being more backend bound (43% down to 9.5%) to being more frontend bound (12.4% up to 26.0%). Assume a few effects here. Waiting on memory goes down from 34.4% to 6.9%, presumably because these multiple threads are making better use of caches. CPU also goes down but not as much. On the frontend side both latency stalls and bandwidth stalls become more important.
This test is useful to compare with other workloads and also other processors.