
The following chart shows the Phoronix test suite coremark value when running from 1 to 16 cores.
| Cores | Coremark | Scaling | Retiring | Frontend | Backend | Speculation | SMT-contention |
|---|---|---|---|---|---|---|---|
| 1 | 43881 | 100% | 43.9% | 12.4% | 43.0% | 0.7% | 0.0% |
| 2 | 85758 | 98% | 43.9% | 12.4% | 43.1% | 0.7% | 0.0% |
| 3 | 128841 | 98% | 43.6% | 13.0% | 42.7% | 0.7% | 0.0% |
| 4 | 171061 | 97% | 43.9% | 12.3% | 43.1% | 0.7% | 0.0% |
| 5 | 210368 | 96% | 43.9% | 12.3% | 43.1% | 0.7% | 0.0% |
| 6 | 251705 | 96% | 43.2% | 12.9% | 43.2% | 0.7% | 0.0% |
| 7 | 281369 | 92% | 43.3% | 12.2% | 43.7% | 0.7% | 0.0% |
| 8 | 319098 | 91% | 42.7% | 12.8% | 43.8% | 0.7% | 0.0% |
| 9 | 334602 | 85% | 40.2% | 15.9% | 36.3% | 0.6% | 7.1% |
| 10 | 347246 | 79% | 38.4% | 17.8% | 30.2% | 0.5% | 13.1% |
| 11 | 359402 | 74% | 36.9% | 19.6% | 25.3% | 0.5% | 17.8% |
| 12 | 363288 | 69% | 35.5% | 21.1% | 21.6% | 0.4% | 21.3% |
| 13 | 362144 | 63% | 34.4% | 22.4% | 18.5% | 0.4% | 24.3% |
| 14 | 377767 | 61% | 33.1% | 24.4% | 15.2% | 0.4% | 26.9% |
| 15 | 397145 | 60% | 32.2% | 25.3% | 12.0% | 0.3% | 30.2% |
| 16 | 418462 | 60% | 31.1% | 26.0% | 9.5% | 0.3% | 33.1% |
Graphically it looks as follows
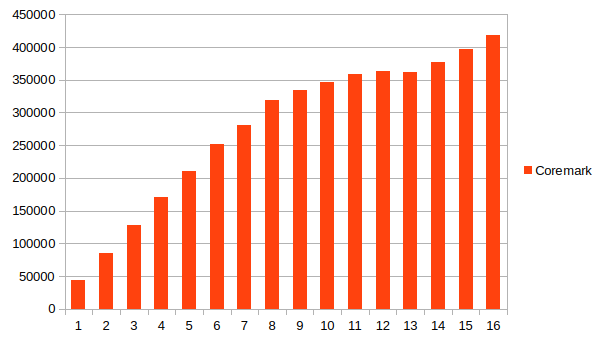
The question is what causes the inflection points on the graph? The scaling from 1-8 cores decreases only slightly and my guess is the inflection point after this happens because of SMT contention. What is interesting is the second inflection point where for the first few additional SMT cores we decline but then settle in after that to become asymptotic to ~60% scaling.
Looking at the topdown performance counter profiles gives two general trends
- As hyper-threaded cores are used, the amount of SMT contention goes up. This is somewhat expected for this workload with moderately high retirement rate. One limiter is is that the core is busy with the other thread.
- The workload shifts from being more backend bound (43% down to 9.5%) to being more frontend bound (12.4% up to 26.0%). Assume a few effects here. Waiting on memory goes down from 34.4% to 6.9%, presumably because these multiple threads are making better use of caches. CPU also goes down but not as much. On the frontend side both latency stalls and bandwidth stalls become more important.
This test is useful to compare with other workloads and also other processors.