↓
 

Performance analysis, tools and experiments

An eclectic collection

  • Overview
  • Blog
  • Workloads
    • cpu2017
      • 500.perlbench_r
      • 502.gcc_r
      • 503.bwaves_r
      • 505.mcf_r
      • 507.cactuBSSN_r
      • 508.namd_r
      • 510.parest_r
      • 511.povray_r
      • 519.lbm_r
      • 520.omnetpp_r
      • 521.wrf_r
      • 523.xalancbmk_r
      • 525.x264_r
      • 526.blender_r
      • 527.cam4_r
      • 531.deepsjeng_r
      • 538.imagick_r
      • 541.leela_r
      • 544.nab_r
      • 548.exchange2_r
      • 549.fotonik3d_r
      • 554.roms_r
      • 557.xz_r
    • geekbench
    • lmbench
    • passmark
    • pbbs
    • phoronix
      • ai-benchmark
      • aircrack-ng
      • amg
      • aobench
      • aom-av1
      • apache
      • apache-iotdb
      • appleseed
      • arrayfire
      • askap
      • asmfish
      • astcenc
      • avifenc
      • basis
      • blake2
      • blogbench
      • blender
      • blosc
      • bork
      • botan
      • brl-cad
      • build-apache
      • build-clash
      • build-eigen
      • build-erlang
      • build-ffmpeg
      • build-gcc
      • build-gdb
      • build-gem5
      • build-godot
      • build-imagemagick
      • build-linux-kernel
      • build-llvm
      • build-mesa
      • build-mplayer
      • build-nodejs
      • build-php
      • build-python
      • build-wasmer
      • build2
      • bullet
      • byte
      • cachebench
      • cassandra
      • clickhouse
      • clomp
      • cloverleaf
      • cockroach
      • compilebench
      • compress-7zip
      • compress-gzip
      • compress-lz4
      • compress-pbzip2
      • compress-rar
      • compress-xz
      • compress-zstd
      • core-latency
      • coremark
      • cp2k
      • cpp-perf-bench
      • cpuminer-opt
      • crafty
      • c-ray
      • cryptopp
      • cryptsetup
      • ctx-clock
      • cython-bench
      • dacapobench
      • daphne
      • darktable
      • dav1d
      • dbench
      • deepsparse
      • deepspeech
      • dolfyn
      • draco
      • dragonflydb
      • duckdb
      • easywave
      • ebizzy
      • embree
      • encode-flac
      • encode-mp3
      • encode-opus
      • encode-wavpack
      • espeak
      • etcpak
      • faiss
      • fast-cli
      • ffmpeg
      • ffte
      • fftw
      • fhourstones
      • financebench
      • furmark
      • gcrypt
      • gegl
      • gimp
      • git
      • glibc-bench
      • gmpbench
      • gnupg
      • gnuradio
      • go-benchmark
      • gpaw
      • graph500
      • graphics-magick
      • gromacs
      • hackbench
      • hadoop
      • heffte
      • helsing
      • himeno
      • hmmer
      • hpcg
      • incompact3d
      • indigobench
      • inkscape
      • ipc-benchmark
      • java-jmh
      • java-scimark2
      • john-the-ripper
      • jpegxl
      • jpegxl-decode
      • kvazaar
      • kripke
      • lammps
      • lczero
      • libraw
      • libreoffice
      • libxsmm
      • liquid-dsp
      • llama.cpp
      • llamafile
      • lulesh
      • lzbench
      • mbw
      • memcached
      • minibude
      • minife
      • mnn
      • mpcbench
      • m-queens
      • mrbayes
      • mutex
      • namd
      • mt-dgemm
      • ncnn
      • neat
      • nettle
      • nginx
      • ngspice
      • node-octane
      • node-web-tooling
      • npb
      • n-queens
      • numpy
      • nwchem
      • oidn
      • onednn
      • octave-benchmark
      • onnx
      • opencv
      • openfoam
      • openjpeg
      • openssl
      • openradioss
      • openscad
      • openvino
      • openvkl
      • ospray
      • ospray-studio
      • palabos
      • parboil
      • pennant
      • perl-benchmark
      • pgbench
      • phpbench
      • pjsip
      • polybench-c
      • polyhedron
      • povray
      • primesieve
      • pybench
      • pyhpc
      • pyperformance
      • pytorch
      • quadray
      • qe
      • qmcpack
      • quantlib
      • quicksilver
      • ramspeed
      • rav1e
      • rawtherapee
      • rbenchmark
      • redis
      • renaissance
      • rnnoise
      • rocksdb
      • rodinia
      • rsvg
      • schbench
      • scikit-learn
      • scimark2
      • scylladb
      • securemark
      • selenium
      • simdjson
      • smallpt
      • smhasher
      • spark
      • spark-tpcds
      • speedb
      • specfem3d
      • sqlite
      • srsran
      • stargate
      • stockfish
      • stream
      • stress-ng
      • svt-av1
      • svt-hevc
      • svt-vp9
      • sudokut
      • synthmark
      • sysbench
      • tensorflow
      • tensorflow-lite
      • tesseract
      • tjbench
      • tnn
      • toybrot
      • tscp
      • ttsiod-renderer
      • tungsten
      • uvg266
      • vkpeak
      • vpxenc
      • v-ray
      • vvenc
      • webp
      • webp2
      • whisper.cpp
      • whisperfile
      • wireguard
      • x264
      • x265
      • xmrig
      • xnnpack
      • y-cruncher
      • z3
    • stream
  • Tools
    • Compilers
    • likwid
    • perf
    • trace-cmd and kernelshark
    • wspy
  • Experiments
    • Histograms
    • clustering
    • Adding summary statistics for all benchmarks
  • Home
  • Blog
  • Workloads
    • cpu2017
      • 500.perlbench_r
      • 502.gcc_r
      • 503.bwaves_r
      • 505.mcf_r
      • 507.cactuBSSN_r
      • 508.namd_r
      • 510.parest_r
      • 511.povray_r
      • 519.lbm_r
      • 520.omnetpp_r
      • 521.wrf_r
      • 523.xalancbmk_r
      • 525.x264_r
      • 526.blender_r
      • 527.cam4_r
      • 531.deepsjeng_r
      • 538.imagick_r
      • 541.leela_r
      • 544.nab_r
      • 548.exchange2_r
      • 549.fotonik3d_r
      • 554.roms_r
      • 557.xz_r
    • geekbench
    • lmbench
    • passmark
    • pbbs
    • phoronix
      • ai-benchmark
      • aircrack-ng
      • amg
      • aobench
      • aom-av1
      • apache
      • apache-iotdb
      • appleseed
      • arrayfire
      • askap
      • asmfish
      • astcenc
      • avifenc
      • b
      • basis
      • blake2
      • blender
      • blogbench
      • blosc
      • bork
      • botan
      • brl-cad
      • build-apache
      • build-clash
      • build-eigen
      • build-erlang
      • build-ffmpeg
      • build-gcc
      • build-gdb
      • build-gem5
      • build-godot
      • build-imagemagick
      • build-linux-kernel
      • build-llvm
      • build-mesa
      • build-mplayer
      • build-nodejs
      • build-php
      • build-python
      • build-wasmer
      • build2
      • bullet
      • byte
      • c-ray
      • cachebench
      • cassandra
      • clickhouse
      • clomp
      • cloverleaf
      • cockroach
      • compilebench
      • compress-7zip
      • compress-gzip
      • compress-lz4
      • compress-pbzip2
      • compress-rar
      • compress-xz
      • compress-zstd
      • core-latency
      • coremark
      • cp2k
      • cpp-perf-bench
      • cpuminer-opt
      • crafty
      • cryptopp
      • cryptsetup
      • ctx-clock
      • cython-bench
      • dacapobench
      • daphne
      • darktable
      • dav1d
      • dbench
      • deepsparse
      • deepspeech
      • dolfyn
      • draco
      • dragonflydb
      • duckdb
      • easywave
      • ebizzy
      • embree
      • encode-flac
      • encode-mp3
      • encode-opus
      • encode-wavpack
      • espeak
      • etcpak
      • faiss
      • fast-cli
      • ffmpeg
      • ffte
      • fftw
      • fhourstones
      • financebench
      • furmark
      • gcrypt
      • gegl
      • gimp
      • git
      • glibc-bench
      • gmpbench
      • gnupg
      • gnuradio
      • go-benchmark
      • gpaw
      • graph500
      • graphics-magick
      • gromacs
      • hackbench
      • hadoop
      • heffte
      • helsing
      • himeno
      • hmmer
      • hpcg
      • incompact3d
      • indigobench
      • inkscape
      • ipc-benchmark
      • java-jmh
      • java-scimark2
      • john-the-ripper
      • jpegxl
      • jpegxl-decode
      • kripke
      • kvazaar
      • lammps
      • lczero
      • libraw
      • libreoffice
      • libxsmm
      • liquid-dsp
      • llama.cpp
      • llamafile
      • lulesh
      • lzbench
      • m-queens
      • mbw
      • memcached
      • minibude
      • minife
      • mnn
      • mpcbench
      • mrbayes
      • mt-dgemm
      • mutex
      • n-queens
      • namd
      • ncnn
      • neat
      • nettle
      • nginx
      • ngspice
      • node-octane
      • node-web-tooling
      • npb
      • numpy
      • nwchem
      • octave-benchmark
      • oidn
      • onednn
      • onnx
      • opencv
      • openfoam
      • openjpeg
      • openradioss
      • openscad
      • openssl
      • openvino
      • openvkl
      • ospray
      • ospray-studio
      • palabos
      • parboil
      • pennant
      • perl-benchmark
      • pgbench
      • phpbench
      • pjsip
      • polybench-c
      • polyhedron
      • povray
      • primesieve
      • pybench
      • pyhpc
      • pyperformance
      • pytorch
      • qe
      • qmcpack
      • quadray
      • quantlib
      • quicksilver
      • ramspeed
      • rav1e
      • rawtherapee
      • rays1bench
      • rbenchmark
      • redis
      • renaissance
      • rnnoise
      • rocksdb
      • rodinia
      • rsvg
      • schbench
      • scikit-learn
      • scimark2
      • scylladb
      • securemark
      • selenium
      • simdjson
      • smallpt
      • smhasher
      • spark
      • spark-tpcds
      • specfem3d
      • speedb
      • sqlite
      • srsran
      • stargate
      • stockfish
      • stream
      • stress-ng
      • sudokut
      • svt-av1
      • svt-hevc
      • svt-vp9
      • synthmark
      • sysbench
      • tensorflow
      • tensorflow-lite
      • tesseract
      • tjbench
      • tnn
      • toybrot
      • tscp
      • ttsiod-renderer
      • tungsten
      • uvg266
      • v-ray
      • vkpeak
      • vpxenc
      • vvenc
      • webp
      • webp2
      • whisper.cpp
      • whisperfile
      • wireguard
      • x264
      • x265
      • xmrig
      • xnnpack
      • y-cruncher
      • z3
    • stream
  • Tools
    • Compilers
    • likwid
    • perf
    • trace-cmd and kernelshark
    • wspy
  • Experiments
Home→Tags stream

Tag Archives: stream

New Ryzen AI 9 HX 370 machine

Performance analysis, tools and experiments Posted on October 8, 2024 by mevOctober 10, 2024

I have a new AMD performance machine for experiments. The processor is a Ryzen AI 9 HX 370 in a Beelink SER9 mini-PC.

Following are some of the major parameters.in comparison with my Ryzen 7840HS comparison machine.

ItemRyzen 7840HSRyzen AI 9 HX 370Notes
ArchitectureZen4Zen 5
Cores812
(4x Zen 5 and 8x Zen 5c)
Threads1624
Base Clock3.8 GHz2.0 GHz, 2.0 GHz
Boost Clock5.1 GHz5.1 GHz, 3.3 GHz
TDP35-45W15-54WSet by vendor
Memory32 GB (2 x 16 GiB)

DDR5 – 5600

2 Memory Channels
32 GB (4x 8 GiB)

DDR5 – 7500

2 Memory Channels
Check BIOS for actual speed
StreamCopy: 71400 MB/s
Scale: 70300 MB/s
Add: 73600 MB/s
Triad: 73000 MB/s
Copy: 86725 MB/s
Scale: 86626 MS/s
Add: 88192 MB/s
Triad: 87655 MB/s
Measured
CacheL1 – 32kB, 8 way, 4 clocks

L2 – 1 MB, 8-way, 14 clocks

L3 – 16MB, 24 way, 47 clocks
L1 – 32kB

L2 – 1 MB

L3 – 24 MB
Agner Fog architecture document and likwid-topology
lmbenchL1 – 0.8 ns
L2 – 3 ns
L3 – 8 ns
L1 – 0.8 ns
L2 – 3ns
L3 – 8 ns
Measured in Nanoseconds
GraphicsRadeon 780M

12 cores

2700 MHz
Radeon 890M

16 cores

2900 MHz
Phoronix streamAverage: 40604 MB/sAverage 44500 MB/s
Phoronix coremarkAverage 464076 Iterations/secondAverage 563477 Iterations/second+21%

Following are the results from likwid-topology. This is a hybrid core with four Zen5 cores and eight Zen5c cores. I believe the first four cores are Zen5 and the remaining eight are Zen5c.

--------------------------------------------------------------------------------
CPU name:	AMD Ryzen AI 9 HX 370 w/ Radeon 890M           
CPU type:	nil
CPU stepping:	0
********************************************************************************
Hardware Thread Topology
********************************************************************************
Sockets:		1
Cores per socket:	12
Threads per core:	2
--------------------------------------------------------------------------------
HWThread        Thread        Core        Die        Socket        Available
0               0             0           0          0             *                
1               0             1           0          0             *                
2               0             2           0          0             *                
3               0             3           0          0             *                
4               0             4           0          0             *                
5               0             5           0          0             *                
6               0             6           0          0             *                
7               0             7           0          0             *                
8               0             8           0          0             *                
9               0             9           0          0             *                
10              0             10          0          0             *                
11              0             11          0          0             *                
12              1             0           0          0             *                
13              1             1           0          0             *                
14              1             2           0          0             *                
15              1             3           0          0             *                
16              1             4           0          0             *                
17              1             5           0          0             *                
18              1             6           0          0             *                
19              1             7           0          0             *                
20              1             8           0          0             *                
21              1             9           0          0             *                
22              1             10          0          0             *                
23              1             11          0          0             *                
--------------------------------------------------------------------------------
Socket 0:		( 0 12 1 13 2 14 3 15 4 16 5 17 6 18 7 19 8 20 9 21 10 22 11 23 )
--------------------------------------------------------------------------------
********************************************************************************
Cache Topology
********************************************************************************
Level:			1
Size:			48 kB
Cache groups:		( 0 12 ) ( 1 13 ) ( 2 14 ) ( 3 15 ) ( 4 16 ) ( 5 17 ) ( 6 18 ) ( 7 19 ) ( 8 20 ) ( 9 21 ) ( 10 22 ) ( 11 23 )
--------------------------------------------------------------------------------
Level:			2
Size:			1 MB
Cache groups:		( 0 12 ) ( 1 13 ) ( 2 14 ) ( 3 15 ) ( 4 16 ) ( 5 17 ) ( 6 18 ) ( 7 19 ) ( 8 20 ) ( 9 21 ) ( 10 22 ) ( 11 23 )
--------------------------------------------------------------------------------
Level:			3
Size:			16 MB
Cache groups:		( 0 12 1 13 2 14 3 15 ) ( 4 16 5 17 6 18 7 19 ) ( 8 20 9 21 10 22 11 23 )
--------------------------------------------------------------------------------
********************************************************************************
NUMA Topology
********************************************************************************
NUMA domains:		1
--------------------------------------------------------------------------------
Domain:			0
Processors:		( 0 12 1 13 2 14 3 15 4 16 5 17 6 18 7 19 8 20 9 21 10 22 11 23 )
Distances:		10
Free memory:		22667.5 MB
Total memory:		27574.2 MB
--------------------------------------------------------------------------------

The L3 cache amount may be incorrect as specifications suggest 24 MB of cache. Using lmbench suggests the L3 cache attached to first four cores is 16MB and the next groups have 8MB likely together even though topology above makes them separate.

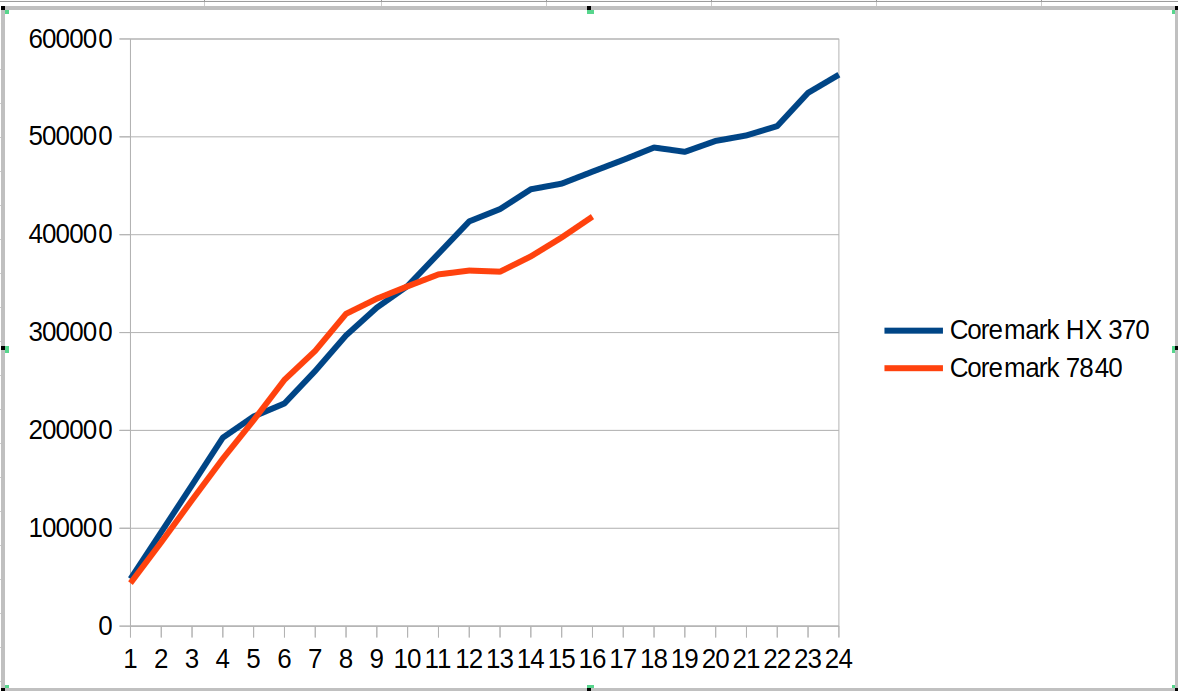
This hybrid SOC shows up in the following coremark scaling comparison as shown in the graph below. There are several different regions

  • From 1 to 4 cores we compare Zen4 cores against Zen5 cores. The coremark value for 4 cores is ~12% ahead.
  • From 5 to 8 cores, we now have Zen5 + Zen5C cores against Zen4 cores. The coremark value for 8 cores is ~7% behind
  • From 9 to 12 cores, we use all the cores on HX 370 and start using SMT for the 7840. The coremark value for 12 cores is 6% ahead
  • From 13 to 16 cores we go to using SMT for all the Zen5 cores and not-SMT for Zen5C cores. The 7840 moves to fully SMT. The coremark value for 16 cores is 11% ahead
  • From 17 to 24 cores, we go to adding SMT for Zen5C cores. The overall coremark using all cores (24 vs 16) is 21% ahead.

This suggests for coremark and other workloads there will be different regions where combinations of SMT and Zen5 vs Zen5C cores will create interesting comparisons between the systems.

The tabular version of coremark including performance counters is shown below.

CoresCoremark HX 370Coremark 7840Scaling HX 370Scaling 7840Retiring HX 370Frontend HX 370Backend HX 370Speculation HX 370SMT-contention HX 370Retiring 7840Frontend 7840Backend 7840Speculation 7840SMT-contention 7840
14824543881100%100%44.2%25.2%62.0%2.0%0.0%43.9%12.4%43.0%0.7%0.0%
29610685758100%98%44.0%25.5%61.8%2.0%0.0%43.9%12.4%43.1%0.7%0.0%
3144147128841100%98%44.0%25.5%61.8%2.0%0.0%43.6%13.0%42.7%0.7%0.0%
4192537171061100%97%44.1%25.4%61.9%2.0%0.0%43.9%12.3%43.1%0.7%0.0%
521422321036889%96%44.0%25.5%61.8%2.0%0.0%43.9%12.3%43.1%0.7%0.0%
622753225170579%96%44.0%25.4%61.9%2.0%0.0%43.2%12.9%43.2%0.7%0.0%
726081128136977%92%44.0%25.7%61.7%2.0%0.0%43.3%12.2%43.7%0.7%0.0%
829700231909877%91%44.1%25.3%61.9%2.0%0.0%42.7%12.8%43.8%0.7%0.0%
932541733460275%85%44.1%25.3%62.0%2.0%0.0%40.2%15.9%36.3%0.6%7.1%
1034763634724672%79%44.0%25.3%61.9%2.0%0.0%38.4%17.8%30.2%0.5%13.1%
1138058735940272%74%44.0%25.5%61.8%2.0%0.0%36.9%19.6%25.3%0.5%17.8%
1241357536328871%69%44.0%25.4%61.9%2.0%0.0%35.5%21.1%21.6%0.4%21.3%
1342612336214468%63%42.1%28.2%52.9%1.8%8.3%34.4%22.4%18.5%0.4%24.3%
1444637937776766%61%40.5%30.6%45.6%1.6%15.1%33.1%24.4%15.2%0.4%26.9%
1545213439714562%60%39.5%32.2%40.6%1.4%19.7%32.2%25.3%12.0%0.3%30.2%
1646443141846260%60%38.3%33.7%35.8%1.3%24.2%31.1%26.0%9.5%0.3%33.1%
1747641658%37.9%34.4%33.5%1.2%26.3%
1848900156%37.2%35.0%31.2%1.2%28.7%
1948465553%36.6%35.4%29.2%1.1%30.9%
2049582651%36.5%36.5%26.3%1.0%33.1%
2150145749%35.7%37.3%23.9%1.0%35.5%
2251094648%35.1%37.7%22.0%0.9%37.6%
2354489549%34.7%38.5%19.5%0.8%39.8%
2456347749%34.0%38.2%19.4%0.8%40.9%

I also measured stream and it looks ~15% faster than my 7840 system.

-------------------------------------------------------------
STREAM version $Revision: 5.10 $
-------------------------------------------------------------
This system uses 8 bytes per array element.
-------------------------------------------------------------
Array size = 100000000 (elements), Offset = 0 (elements)
Memory per array = 762.9 MiB (= 0.7 GiB).
Total memory required = 2288.8 MiB (= 2.2 GiB).
Each kernel will be executed 100 times.
 The *best* time for each kernel (excluding the first iteration)
 will be used to compute the reported bandwidth.
-------------------------------------------------------------
Number of Threads requested = 2
Number of Threads counted = 2
-------------------------------------------------------------
Your clock granularity/precision appears to be 1 microseconds.
Each test below will take on the order of 31409 microseconds.
   (= 31409 clock ticks)
Increase the size of the arrays if this shows that
you are not getting at least 20 clock ticks per test.
-------------------------------------------------------------
WARNING -- The above is only a rough guideline.
For best results, please be sure you know the
precision of your system timer.
-------------------------------------------------------------
Function    Best Rate MB/s  Avg time     Min time     Max time
Copy:           86725.2     0.018665     0.018449     0.021070
Scale:          86626.7     0.018713     0.018470     0.020643
Add:            88192.8     0.027540     0.027213     0.031095
Triad:          87655.3     0.027729     0.027380     0.031028
-------------------------------------------------------------
Solution Validates: avg error less than 1.000000e-13 on all three arrays
-------------------------------------------------------------

Here is a phoronix article comparing Ryzen AI 9 HX 370 with a variety of laptop systems. The overall geomean is ~10% but there is a wider variety between tests. Can be interesting to puzzle out why some of the differences. It is also likely that the power points used for the laptop comparisons in the phoronix article are less since I see lower scores e.g. coremark or different gaps than what I see with the same benchmark. So will need to puzzle out some of the SOC/power choices.

Posted in experiment, hardware | Tagged 7840HS, coremark, Ryzen AI 9 HX 370, stream, Zen5 | Leave a reply

Stream, experiments

Performance analysis, tools and experiments Posted on December 16, 2023 by mevDecember 17, 2023

I copied Stream from https://www.cs.virginia.edu/stream/ and put a copy in https://github.com/cycletourist/perf. This suggested the following compilation flags

/opt/AMD/aocc-compiler-4.1.0/bin/clang -O2 -fopenmp -mcmodel=large -ffp-contract=fast -fnt-store stream.c -DSTREAM_TYPE=double -DSTREAM_ARRAY_SIZE=100000000 -DNTIMES=100 -o stream

On my system with a Ryzen 7 7800X3D this results in the following performance:

Function    Best Rate MB/s  Avg time     Min time     Max time
Copy:           44965.3     0.035895     0.035583     0.041095
Scale:          44902.1     0.035803     0.035633     0.040071
Add:            44214.4     0.054599     0.054281     0.057224
Triad:          44659.5     0.054155     0.053740     0.062816

The question is what is the sensitivity of various alternatives for compiling/running stream and can I do better than roughly ~45k MB/s?

Number of threads

The first dimension to try is the number of concurrent threads. By default, we run on all cores so 16 threads (8 cores by 2-way hyperthreading). However, there are only two memory channels on the processor, so perhaps if we limit threads we get less contention? Using likwid-topology we see the following

********************************************************************************
Cache Topology
********************************************************************************
Level:			1
Size:			32 kB
Cache groups:		( 0 8 ) ( 1 9 ) ( 2 10 ) ( 3 11 ) ( 4 12 ) ( 5 13 ) ( 6 14 ) ( 7 15 )
--------------------------------------------------------------------------------
Level:			2
Size:			1 MB
Cache groups:		( 0 8 ) ( 1 9 ) ( 2 10 ) ( 3 11 ) ( 4 12 ) ( 5 13 ) ( 6 14 ) ( 7 15 )
--------------------------------------------------------------------------------
Level:			3
Size:			96 MB
Cache groups:		( 0 8 1 9 2 10 3 11 4 12 5 13 6 14 7 15 )
--------------------------------------------------------------------------------

So other than avoiding the same core which share L1/L2, we try lower numbers of threads. Using 8 copies (one for each core) and “taskset -c 0,1,2,3,4,5,7 we are slightly higher

Function    Best Rate MB/s  Avg time     Min time     Max time
Copy:           45801.8     0.035042     0.034933     0.036696
Scale:          45887.3     0.034946     0.034868     0.035780
Add:            44956.4     0.053540     0.053385     0.054156
Triad:          45478.8     0.052950     0.052772     0.053537

Using 4 copies and “taskset -c 0,2,4,6” we are higher still

Function    Best Rate MB/s  Avg time     Min time     Max time
Copy:           47930.1     0.033463     0.033382     0.034021
Scale:          47935.9     0.033456     0.033378     0.033836
Add:            47367.2     0.050786     0.050668     0.051453
Triad:          47514.5     0.050662     0.050511     0.053086

Using 2 copies and “taskset -c 0,4” we are even higher

Function    Best Rate MB/s  Avg time     Min time     Max time
Copy:           49953.0     0.032219     0.032030     0.032577
Scale:          50139.6     0.032096     0.031911     0.032346
Add:            49384.7     0.048934     0.048598     0.049323
Triad:          49297.6     0.049014     0.048684     0.049403

Using 1 copy and “taskset -c 0” we are lower again

Function    Best Rate MB/s  Avg time     Min time     Max time
Copy:           45256.7     0.035486     0.035354     0.035758
Scale:          45941.4     0.034933     0.034827     0.035466
Add:            45713.4     0.052640     0.052501     0.053054
Triad:          45691.7     0.052665     0.052526     0.053191

For completeness, we try using 3 copies and “taskset -c 0,2,4” and are also slightly lower than the two copy run

Function    Best Rate MB/s  Avg time     Min time     Max time
Copy:           49209.8     0.032582     0.032514     0.032765
Scale:          49169.0     0.032624     0.032541     0.032854
Add:            48532.8     0.049577     0.049451     0.049879
Triad:          48672.6     0.049475     0.049309     0.049913

So looks like for this processor it runs fastest with two threads, one for each memory channel.

Compiler options

The next dimension to try is the compiler and compiler options. Here we expect we have a recommended AOCC compiler and options, so don’t expect removing them to add performance – but useful to see anyways.

Running with “gcc -O2” instead of aocc results in slower performance

gcc -O2 -fopenmp -mcmodel=large stream.c -DSTREAM_TYPE=double -DSTREAM_ARRAY_SIZE=100000000 -DNTIMES=100 -o stream

Function    Best Rate MB/s  Avg time     Min time     Max time
Copy:           38927.6     0.041432     0.041102     0.041713
Scale:          31689.5     0.050793     0.050490     0.051133
Add:            34335.7     0.070263     0.069898     0.070816
Triad:          34257.9     0.070204     0.070057     0.070589

The -fnt-store option uses a non-temporal store. This keeps the processor from keeping entries in the caches. This makes sense for stream since we are streaming through memory much larger than the cache and it otherwise gets polluted where cache entries conflict with new fetches from memory. Removing the -fnt-store option results in numbers close to the gcc numbers

/opt/AMD/aocc-compiler-4.1.0/bin/clang -O2 -fopenmp -mcmodel=large -ffp-contract=fast stream.c -DSTREAM_TYPE=double -DSTREAM_ARRAY_SIZE=100000000 -DNTIMES=100 -o stream

Function    Best Rate MB/s  Avg time     Min time     Max time
Copy:           38575.4     0.041629     0.041477     0.041940
Scale:          31698.9     0.050659     0.050475     0.051251
Add:            34480.2     0.069831     0.069605     0.070409
Triad:          34473.8     0.069811     0.069618     0.070233

The -ffp-contract=fast option allows different core for contractions (e.g. multiply and add) so should primarily focus on “triad” which has those options. We essentially see no difference removing this option, so that may be a “don’t care”

/opt/AMD/aocc-compiler-4.1.0/bin/clang -O2 -fopenmp -mcmodel=large -fnt-store stream.c -DSTREAM_TYPE=double -DSTREAM_ARRAY_SIZE=100000000 -DNTIMES=100 -o stream

Function    Best Rate MB/s  Avg time     Min time     Max time
Copy:           49973.1     0.032147     0.032017     0.032620
Scale:          50160.2     0.032049     0.031898     0.033233
Add:            49402.9     0.048854     0.048580     0.050982
Triad:          49385.9     0.048923     0.048597     0.049789

The -O3 option performance set of optimizations such as vectorization and loop optimizations. While beneficial to some codes, this slows down slightly for stream suggesting these are not helpful

/opt/AMD/aocc-compiler-4.1.0/bin/clang -O3 -fopenmp -mcmodel=large -ffp-contract=fast -fnt-store stream.c -DSTREAM_TYPE=double -DSTREAM_ARRAY_SIZE=100000000 -DNTIMES=100 -o stream

Function    Best Rate MB/s  Avg time     Min time     Max time
Copy:           49810.3     0.032276     0.032122     0.032575
Scale:          49892.5     0.032225     0.032069     0.032478
Add:            48962.7     0.049157     0.049017     0.049637
Triad:          49026.6     0.049232     0.048953     0.049644

So overall, we use the options given.

Another point of comparison is the Intel compiler (icx). Compiling with options -axCORE-AVX2 -O3 -qopenmp -qopt-streaming-stores results in slightly lower performance. Will check this with an Intel system as well.

Function    Best Rate MB/s  Avg time     Min time     Max time
Copy:           47829.7     0.033554     0.033452     0.033797
Scale:          31703.3     0.050603     0.050468     0.050823
Add:            34460.0     0.069887     0.069646     0.070249
Triad:          34514.5     0.069775     0.069536     0.070086

Memory configuration

The other alternative we do not change is the memory configuration. This system has the following memory – https://www.gskill.com/product/165/374/1648545408/F5-5600J3636D32GX2-TZ5RK-F5-5600J3636D32GA2-TZ5RK. Each DIMM is 32 GB and there are four dimms. This thread suggests that DDR5 with 32GB are dual rank and DDR5 with 8GB are single rank. Also the processor specification suggests that 2x2R can run at DDR5-5200 and 4x2R runs at DDR5-3600.

I haven’t done the experiments but there is a suggestion that if this processor is paired with 16GB of RAM in 2 DIMMs that perhaps we can see faster stream performance than the current 128GB of RAM in 4 DIMMs. There would of course be a tradeoff on other workloads with a larger working set size.

Versions of Stream

Another variable would be the specific version of stream. As a comparison, I tried running the phoronix-test-suite copy of the stream benchmark and got the following results

Stream 2013-01-17:
    pts/stream-1.3.4 [Type: Copy]
    Test 1 of 4
    Estimated Trial Run Count:    5                      
    Estimated Test Run-Time:      4 Minutes              
    Estimated Time To Completion: 16 Minutes [15:04 CST] 
        Started Run 1 @ 14:48:35
        Started Run 2 @ 14:50:18
        Started Run 3 @ 14:52:02
        Started Run 4 @ 14:53:45
        Started Run 5 @ 14:55:28

    Type: Copy:
        44593
        44619.9
        44697.6
        44632.3
        44658.9

    Average: 44640.3 MB/s
    Deviation: 0.09%

Stream 2013-01-17:
    pts/stream-1.3.4 [Type: Scale]
    Test 2 of 4
    Estimated Trial Run Count:    5                      
    Estimated Test Run-Time:      9 Minutes              
    Estimated Time To Completion: 26 Minutes [15:22 CST] 
        Utilizing Data From Shared Cache @ 14:57:12

    Type: Scale:
        28951.6
        28930.4
        28951.2
        28969.1
        28933.6

    Average: 28947.2 MB/s
    Deviation: 0.05%

Stream 2013-01-17:
    pts/stream-1.3.4 [Type: Triad]
    Test 3 of 4
    Estimated Trial Run Count:    5                      
    Estimated Test Run-Time:      9 Minutes              
    Estimated Time To Completion: 17 Minutes [15:13 CST] 
        Utilizing Data From Shared Cache @ 14:57:14

    Type: Triad:
        32139.4
        32127.3
        32150.8
        32161.8
        32152.7

    Average: 32146.4 MB/s
    Deviation: 0.04%

Stream 2013-01-17:
    pts/stream-1.3.4 [Type: Add]
    Test 4 of 4
    Estimated Trial Run Count:    5                     
    Estimated Time To Completion: 9 Minutes [15:05 CST] 
        Utilizing Data From Shared Cache @ 14:57:16

    Type: Add:
        32140.2
        32135.8
        32107.5
        32110.3
        32120.3

    Average: 32122.8 MB/s
    Deviation: 0.05%

These are substantially slower. A peek at the installed directory and run logs suggests several reasons

  • Sixteen threads are run instead of two
  • The compiler is gcc and compiler options are “-mcmodel=medium -O3 -march=native -fopenmp”
  • We run an array size of 402653184 elements instead of 100000000 elements (though I suspect this doesn’t have as much effect)

The other remaining variable would be to find the older version of stream I previously ran ~five years ago. Will find this and also compare.

Posted in experiment | Tagged stream | Leave a reply

Meta

  • Log in
  • Entries feed
  • Comments feed
  • WordPress.org

Archives

  • November 2024
  • October 2024
  • September 2024
  • July 2024
  • June 2024
  • March 2024
  • February 2024
  • January 2024
  • December 2023
  • February 2023

Tags

7840HS bad data benchmarks cachyos cluster compiler coremark cpu2017 data fabric getrusage gnuplot i5-13500H icache ipc kernel l3 metrics namd opcache perf performance counters perf_event_open phoronix Ryzen AI 9 HX 370 Ryzen AI 365 scaling stream threshold topdown tree virtualization website wsl Zen5

Recent Posts

  • Virtualization comparisons
  • Updating to a new kernel and graphics driver
  • SPEC CPU2017 Ryzen AI HX 370 vs. Ryzen 7840 HS
  • phoronix – Ryzen AI HX 370 vs Ryzen 7840 HS
  • New Ryzen AI 9 HX 370 machine
©2026 - Performance analysis, tools and experiments - Weaver Xtreme Theme
↑