
Onnx runtime with 20 different workloads. These run with a variety of different parallelism.
Topdown profile shows mostly backend bound with periods of high frontend stalls.

AMD metrics show running on half the cores, not much floating point, with moderate L2 hit rate. Backend bound with high memory stalls but also CPU stalls.
elapsed              7666.905
on_cpu               0.484          # 7.75 / 16 cores
utime                59267.083
stime                121.864
nvcsw                126506         # 56.48%
nivcsw               97469          # 43.52%
inblock              8              # 0.00/sec
onblock              31152          # 4.06/sec
cpu-clock            59392070765107 # 59392.071 seconds
task-clock           59392404433514 # 59392.404 seconds
page faults          75921573       # 1278.304/sec
context switches     261852         # 4.409/sec
cpu migrations       45585          # 0.768/sec
major page faults    268            # 0.005/sec
minor page faults    75921305       # 1278.300/sec
alignment faults     0              # 0.000/sec
emulation faults     0              # 0.000/sec
branches             13964968401705 # 59.551 branches per 1000 inst
branch misses        24286886257    # 0.17% branch miss
conditional          13150504035833 # 56.078 conditional branches per 1000 inst
indirect             75766798166    # 0.323 indirect branches per 1000 inst
cpu-cycles           170936473902854 # 2.13 GHz
instructions         149610925486559 # 0.88 IPC
slots                341882092221648 #
retiring             50270481479148 # 14.7% (15.8%)
-- ucode             449679582297   #     0.1%
-- fastpath          49820801896851 #    14.6%
frontend             7839231529047  #  2.3% ( 2.5%) low
-- latency           3811377380796  #     1.1%
-- bandwidth         4027854148251  #     1.2%
backend              259444684020020 # 75.9% (81.5%) high
-- cpu               108192204233662 #    31.6%
-- memory            151252479786358 #    44.2%
speculation          667988414339   #  0.2% ( 0.2%) low
-- branch mispredict 416633463189   #     0.1%
-- pipeline restart  251354951150   #     0.1%
smt-contention       23659541944969 #  6.9% ( 0.0%)
cpu-cycles           225365754216755 # 1.98 GHz
instructions         209421223495808 # 0.93 IPC
instructions         69791759643743 # 102.929 l2 access per 1000 inst
l2 hit from l1       5092499628764  # 12.04% l2 miss
l2 miss from l1      187031638880   #
l2 hit from l2 pf    1413548447320  #
l3 hit from l2 pf    451119563582   #
l3 miss from l2 pf   226457942800   #
instructions         69772481102765 # 78.194 float per 1000 inst
float 512            167            # 0.000 AVX-512 per 1000 inst
float 256            10196733872    # 0.146 AVX-256 per 1000 inst
float 128            5445615832780  # 78.048 AVX-128 per 1000 inst
float MMX            0              # 0.000 MMX per 1000 inst
float scalar         0              # 0.000 scalar per 1000 inst
instructions         140399342837497 #
opcache              12547602639130 # 89.371 opcache per 1000 inst
opcache miss         336571040544   #  2.7% opcache miss rate
l1 dTLB miss         85216624277    # 0.607 L1 dTLB per 1000 inst
l2 dTLB miss         20923237061    # 0.149 L2 dTLB per 1000 inst
instructions         228624533030111 #
icache               782732232728   # 3.424 icache per 1000 inst
icache miss          106861319043   # 13.7% icache miss rate
l1 iTLB miss         4080671841     # 0.018 L1 iTLB per 1000 inst
l2 iTLB miss         0              # 0.000 L2 iTLB per 1000 inst
tlb flush            78761          # 0.000 TLB flush per 1000 inst
Intel metrics show most backend stalls are CPU stalls.
elapsed              5583.167
on_cpu               0.727          # 11.64 / 16 cores
utime                64884.355
stime                77.838
nvcsw                91202          # 20.23%
nivcsw               359685         # 79.77%
inblock              352            # 0.06/sec
onblock              18768          # 3.36/sec
cpu-clock            64965405314194 # 64965.405 seconds
task-clock           64965592525832 # 64965.593 seconds
page faults          60825931       # 936.279/sec
context switches     478409         # 7.364/sec
cpu migrations       61992          # 0.954/sec
major page faults    709            # 0.011/sec
minor page faults    60825222       # 936.268/sec
alignment faults     0              # 0.000/sec
emulation faults     0              # 0.000/sec
branches             9379557277083  # 50.485 branches per 1000 inst
branch misses        22703149215    # 0.24% branch miss
conditional          9379557342747  # 50.485 conditional branches per 1000 inst
indirect             1939366372296  # 10.439 indirect branches per 1000 inst
slots                471739138825190 #
retiring             128933116492684 # 27.3% (27.3%)
-- ucode             7027709037148  #     1.5%
-- fastpath          121905407455536 #    25.8%
frontend             28156329685609 #  6.0% ( 6.0%)
-- latency           20790135084826 #     4.4%
-- bandwidth         7366194600783  #     1.6%
backend              310047888633198 # 65.7% (65.7%)
-- cpu               245552390551012 #    52.1%
-- memory            64495498082186 #    13.7%
speculation          4944247087919  #  1.0% ( 1.0%)
-- branch mispredict 2039556773679  #     0.4%
-- pipeline restart  2904690314240  #     0.6%
smt-contention       0              #  0.0% ( 0.0%)
cpu-cycles           97716947289441 # 1.16 GHz
instructions         110341301754781 # 1.13 IPC
l2 access            3318562539997  # 40.480 l2 access per 1000 inst
l2 miss              1067638444672  # 32.17% l2 miss
cpu-cycles           75242602539682 # 25.9% memory latency
load stalls          18912792284043 #  0.0% l1 bound
l1 miss              19009622083529 #  5.5% l2 bound
l2 miss              14894522086162 #  2.9% l3 bound
l3 miss              12690193751695 # 16.9% dram bound
store_stalls         550951507058   #  0.7% store bound
Process summary shows time in onnxruntime_per
852 processes
	537 onnxruntime_per      292179.20   381.75
	 34 clinfo                  10.07     2.99
	 19 vulkaninfo               0.95     0.57
	  2 vulkani:disk$0           0.10     0.06
	  3 glxinfo:gdrv0            0.08     0.03
	  3 glxinfo:gl0              0.08     0.03
	  6 clang                    0.06     0.06
	  1 llvmpipe-0               0.05     0.03
	  1 llvmpipe-1               0.05     0.03
	  1 llvmpipe-10              0.05     0.03
	  1 llvmpipe-11              0.05     0.03
	  1 llvmpipe-12              0.05     0.03
	  1 llvmpipe-13              0.05     0.03
	  1 llvmpipe-14              0.05     0.03
	  1 llvmpipe-15              0.05     0.03
	  1 llvmpipe-2               0.05     0.03
	  1 llvmpipe-3               0.05     0.03
	  1 llvmpipe-4               0.05     0.03
	  1 llvmpipe-5               0.05     0.03
	  1 llvmpipe-6               0.05     0.03
	  1 llvmpipe-7               0.05     0.03
	  1 llvmpipe-8               0.05     0.03
	  1 llvmpipe-9               0.05     0.03
	  1 glxinfo                  0.04     0.01
	  1 glxinfo:cs0              0.04     0.01
	  1 glxinfo:disk$0           0.04     0.01
	  1 glxinfo:sh0              0.04     0.01
	  1 glxinfo:shlo0            0.04     0.01
	 78 sh                       0.00     0.00
	 54 onnx                     0.00     0.00
	 13 gcc                      0.00     0.00
	 10 gsettings                0.00     0.00
	  8 systemd-detect-          0.00     0.00
	  7 stat                     0.00     0.00
	  6 llvm-link                0.00     0.00
	  4 gmain                    0.00     0.00
	  4 phoronix-test-s          0.00     0.00
	  2 which                    0.00     0.00
	  1 cc                       0.00     0.00
	  1 date                     0.00     0.00
	  1 dconf worker             0.00     0.00
	  1 dirname                  0.00     0.00
	  1 grep                     0.00     0.00
	  1 ifconfig                 0.00     0.00
	  1 ip                       0.00     0.00
	  1 lscpu                    0.00     0.00
	  1 mktemp                   0.00     0.00
	  1 ps                       0.00     0.00
	  1 python                   0.00     0.00
	  1 python3                  0.00     0.00
	  1 qdbus                    0.00     0.00
	  1 readlink                 0.00     0.00
	  1 realpath                 0.00     0.00
	  1 sed                      0.00     0.00
	  1 sort                     0.00     0.00
	  1 stty                     0.00     0.00
	  1 systemctl                0.00     0.00
	  1 template.sh              0.00     0.00
	  1 wc                       0.00     0.00
	  1 xrandr                   0.00     0.00
	  1 xset                     0.00     0.00
18 processes running
47 maximum processes
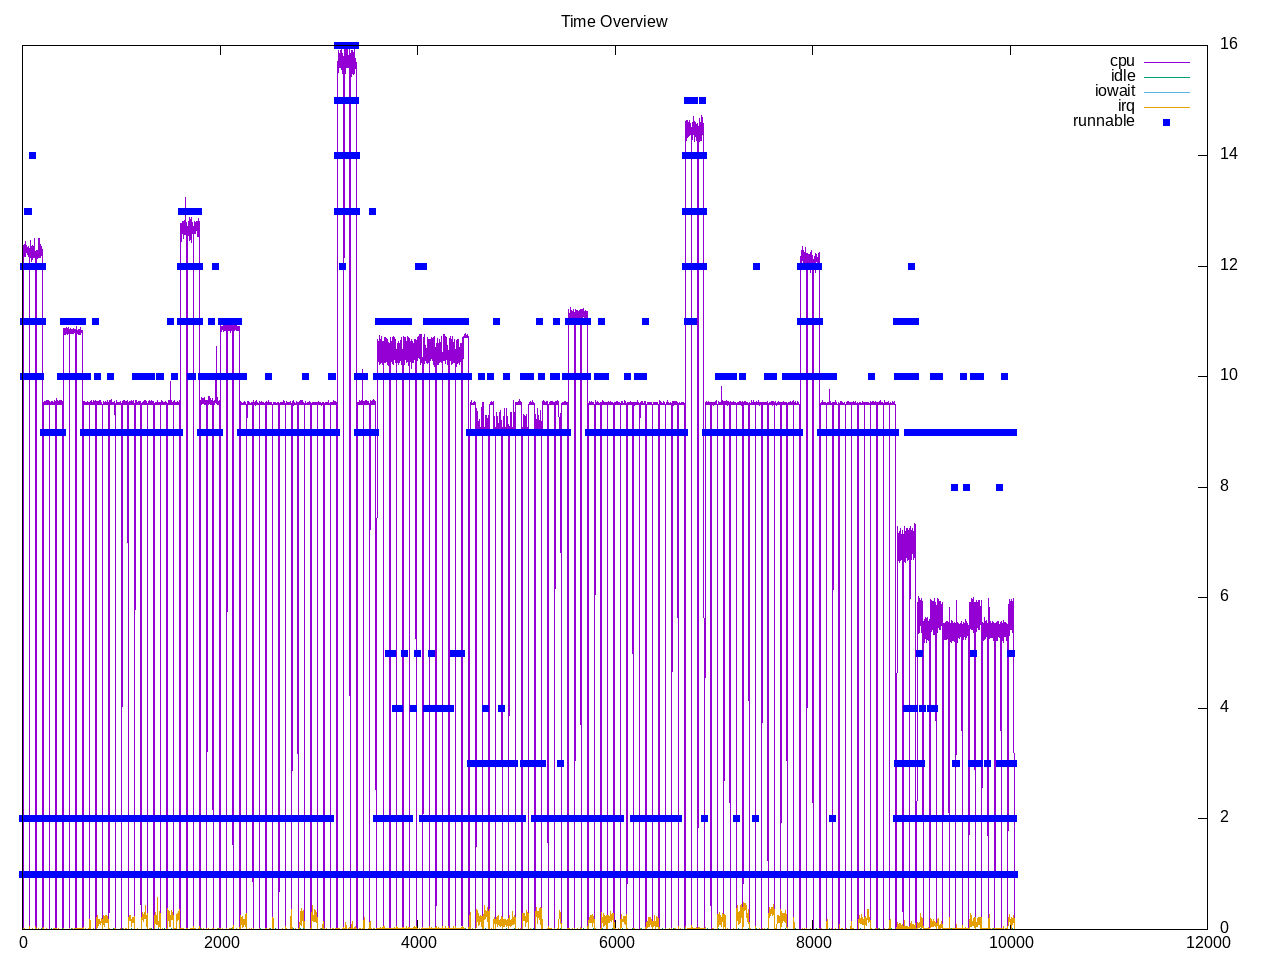
Computation blocks are relatively regular.
      23628) onnx             cpu=1 start=71.35 finish=132.96
        23629) onnxruntime_per  cpu=5 start=71.35 finish=132.94
          23630) onnxruntime_per  cpu=3 start=71.84 finish=132.90
          23631) onnxruntime_per  cpu=4 start=71.84 finish=132.90
          23632) onnxruntime_per  cpu=6 start=71.84 finish=132.90
          23633) onnxruntime_per  cpu=15 start=71.84 finish=132.90
          23634) onnxruntime_per  cpu=8 start=71.84 finish=132.90
          23635) onnxruntime_per  cpu=2 start=71.84 finish=132.90
          23636) onnxruntime_per  cpu=1 start=71.84 finish=132.90
          23637) onnxruntime_per  cpu=14 start=71.85 finish=132.90
          23638) onnxruntime_per  cpu=7 start=71.85 finish=132.90
          23639) onnxruntime_per  cpu=12 start=71.85 finish=132.90
          23640) onnxruntime_per  cpu=0 start=71.85 finish=132.90
          23641) onnxruntime_per  cpu=11 start=71.85 finish=132.90
          23642) onnxruntime_per  cpu=10 start=71.85 finish=132.90
          23643) onnxruntime_per  cpu=5 start=71.85 finish=132.90