↓
 

Performance analysis, tools and experiments

An eclectic collection

  • Overview
  • Blog
  • Workloads
    • cpu2017
      • 500.perlbench_r
      • 502.gcc_r
      • 503.bwaves_r
      • 505.mcf_r
      • 507.cactuBSSN_r
      • 508.namd_r
      • 510.parest_r
      • 511.povray_r
      • 519.lbm_r
      • 520.omnetpp_r
      • 521.wrf_r
      • 523.xalancbmk_r
      • 525.x264_r
      • 526.blender_r
      • 527.cam4_r
      • 531.deepsjeng_r
      • 538.imagick_r
      • 541.leela_r
      • 544.nab_r
      • 548.exchange2_r
      • 549.fotonik3d_r
      • 554.roms_r
      • 557.xz_r
    • geekbench
    • lmbench
    • passmark
    • pbbs
    • phoronix
      • ai-benchmark
      • aircrack-ng
      • amg
      • aobench
      • aom-av1
      • apache
      • apache-iotdb
      • appleseed
      • arrayfire
      • askap
      • asmfish
      • astcenc
      • avifenc
      • basis
      • blake2
      • blogbench
      • blender
      • blosc
      • bork
      • botan
      • brl-cad
      • build-apache
      • build-clash
      • build-eigen
      • build-erlang
      • build-ffmpeg
      • build-gcc
      • build-gdb
      • build-gem5
      • build-godot
      • build-imagemagick
      • build-linux-kernel
      • build-llvm
      • build-mesa
      • build-mplayer
      • build-nodejs
      • build-php
      • build-python
      • build-wasmer
      • build2
      • bullet
      • byte
      • cachebench
      • cassandra
      • clickhouse
      • clomp
      • cloverleaf
      • cockroach
      • compilebench
      • compress-7zip
      • compress-gzip
      • compress-lz4
      • compress-pbzip2
      • compress-rar
      • compress-xz
      • compress-zstd
      • core-latency
      • coremark
      • cp2k
      • cpp-perf-bench
      • cpuminer-opt
      • crafty
      • c-ray
      • cryptopp
      • cryptsetup
      • ctx-clock
      • cython-bench
      • dacapobench
      • daphne
      • darktable
      • dav1d
      • dbench
      • deepsparse
      • deepspeech
      • dolfyn
      • draco
      • dragonflydb
      • duckdb
      • easywave
      • ebizzy
      • embree
      • encode-flac
      • encode-mp3
      • encode-opus
      • encode-wavpack
      • espeak
      • etcpak
      • faiss
      • fast-cli
      • ffmpeg
      • ffte
      • fftw
      • fhourstones
      • financebench
      • furmark
      • gcrypt
      • gegl
      • gimp
      • git
      • glibc-bench
      • gmpbench
      • gnupg
      • gnuradio
      • go-benchmark
      • gpaw
      • graph500
      • graphics-magick
      • gromacs
      • hackbench
      • hadoop
      • heffte
      • helsing
      • himeno
      • hmmer
      • hpcg
      • incompact3d
      • indigobench
      • inkscape
      • ipc-benchmark
      • java-jmh
      • java-scimark2
      • john-the-ripper
      • jpegxl
      • jpegxl-decode
      • kvazaar
      • kripke
      • lammps
      • lczero
      • libraw
      • libreoffice
      • libxsmm
      • liquid-dsp
      • llama.cpp
      • llamafile
      • lulesh
      • lzbench
      • mbw
      • memcached
      • minibude
      • minife
      • mnn
      • mpcbench
      • m-queens
      • mrbayes
      • mutex
      • namd
      • mt-dgemm
      • ncnn
      • neat
      • nettle
      • nginx
      • ngspice
      • node-octane
      • node-web-tooling
      • npb
      • n-queens
      • numpy
      • nwchem
      • oidn
      • onednn
      • octave-benchmark
      • onnx
      • opencv
      • openfoam
      • openjpeg
      • openssl
      • openradioss
      • openscad
      • openvino
      • openvkl
      • ospray
      • ospray-studio
      • palabos
      • parboil
      • pennant
      • perl-benchmark
      • pgbench
      • phpbench
      • pjsip
      • polybench-c
      • polyhedron
      • povray
      • primesieve
      • pybench
      • pyhpc
      • pyperformance
      • pytorch
      • quadray
      • qe
      • qmcpack
      • quantlib
      • quicksilver
      • ramspeed
      • rav1e
      • rawtherapee
      • rbenchmark
      • redis
      • renaissance
      • rnnoise
      • rocksdb
      • rodinia
      • rsvg
      • schbench
      • scikit-learn
      • scimark2
      • scylladb
      • securemark
      • selenium
      • simdjson
      • smallpt
      • smhasher
      • spark
      • spark-tpcds
      • speedb
      • specfem3d
      • sqlite
      • srsran
      • stargate
      • stockfish
      • stream
      • stress-ng
      • svt-av1
      • svt-hevc
      • svt-vp9
      • sudokut
      • synthmark
      • sysbench
      • tensorflow
      • tensorflow-lite
      • tesseract
      • tjbench
      • tnn
      • toybrot
      • tscp
      • ttsiod-renderer
      • tungsten
      • uvg266
      • vkpeak
      • vpxenc
      • v-ray
      • vvenc
      • webp
      • webp2
      • whisper.cpp
      • whisperfile
      • wireguard
      • x264
      • x265
      • xmrig
      • xnnpack
      • y-cruncher
      • z3
    • stream
  • Tools
    • Compilers
    • likwid
    • perf
    • trace-cmd and kernelshark
    • wspy
  • Experiments
    • Histograms
    • clustering
    • Adding summary statistics for all benchmarks
  • Home
  • Blog
  • Workloads
    • cpu2017
      • 500.perlbench_r
      • 502.gcc_r
      • 503.bwaves_r
      • 505.mcf_r
      • 507.cactuBSSN_r
      • 508.namd_r
      • 510.parest_r
      • 511.povray_r
      • 519.lbm_r
      • 520.omnetpp_r
      • 521.wrf_r
      • 523.xalancbmk_r
      • 525.x264_r
      • 526.blender_r
      • 527.cam4_r
      • 531.deepsjeng_r
      • 538.imagick_r
      • 541.leela_r
      • 544.nab_r
      • 548.exchange2_r
      • 549.fotonik3d_r
      • 554.roms_r
      • 557.xz_r
    • geekbench
    • lmbench
    • passmark
    • pbbs
    • phoronix
      • ai-benchmark
      • aircrack-ng
      • amg
      • aobench
      • aom-av1
      • apache
      • apache-iotdb
      • appleseed
      • arrayfire
      • askap
      • asmfish
      • astcenc
      • avifenc
      • b
      • basis
      • blake2
      • blender
      • blogbench
      • blosc
      • bork
      • botan
      • brl-cad
      • build-apache
      • build-clash
      • build-eigen
      • build-erlang
      • build-ffmpeg
      • build-gcc
      • build-gdb
      • build-gem5
      • build-godot
      • build-imagemagick
      • build-linux-kernel
      • build-llvm
      • build-mesa
      • build-mplayer
      • build-nodejs
      • build-php
      • build-python
      • build-wasmer
      • build2
      • bullet
      • byte
      • c-ray
      • cachebench
      • cassandra
      • clickhouse
      • clomp
      • cloverleaf
      • cockroach
      • compilebench
      • compress-7zip
      • compress-gzip
      • compress-lz4
      • compress-pbzip2
      • compress-rar
      • compress-xz
      • compress-zstd
      • core-latency
      • coremark
      • cp2k
      • cpp-perf-bench
      • cpuminer-opt
      • crafty
      • cryptopp
      • cryptsetup
      • ctx-clock
      • cython-bench
      • dacapobench
      • daphne
      • darktable
      • dav1d
      • dbench
      • deepsparse
      • deepspeech
      • dolfyn
      • draco
      • dragonflydb
      • duckdb
      • easywave
      • ebizzy
      • embree
      • encode-flac
      • encode-mp3
      • encode-opus
      • encode-wavpack
      • espeak
      • etcpak
      • faiss
      • fast-cli
      • ffmpeg
      • ffte
      • fftw
      • fhourstones
      • financebench
      • furmark
      • gcrypt
      • gegl
      • gimp
      • git
      • glibc-bench
      • gmpbench
      • gnupg
      • gnuradio
      • go-benchmark
      • gpaw
      • graph500
      • graphics-magick
      • gromacs
      • hackbench
      • hadoop
      • heffte
      • helsing
      • himeno
      • hmmer
      • hpcg
      • incompact3d
      • indigobench
      • inkscape
      • ipc-benchmark
      • java-jmh
      • java-scimark2
      • john-the-ripper
      • jpegxl
      • jpegxl-decode
      • kripke
      • kvazaar
      • lammps
      • lczero
      • libraw
      • libreoffice
      • libxsmm
      • liquid-dsp
      • llama.cpp
      • llamafile
      • lulesh
      • lzbench
      • m-queens
      • mbw
      • memcached
      • minibude
      • minife
      • mnn
      • mpcbench
      • mrbayes
      • mt-dgemm
      • mutex
      • n-queens
      • namd
      • ncnn
      • neat
      • nettle
      • nginx
      • ngspice
      • node-octane
      • node-web-tooling
      • npb
      • numpy
      • nwchem
      • octave-benchmark
      • oidn
      • onednn
      • onnx
      • opencv
      • openfoam
      • openjpeg
      • openradioss
      • openscad
      • openssl
      • openvino
      • openvkl
      • ospray
      • ospray-studio
      • palabos
      • parboil
      • pennant
      • perl-benchmark
      • pgbench
      • phpbench
      • pjsip
      • polybench-c
      • polyhedron
      • povray
      • primesieve
      • pybench
      • pyhpc
      • pyperformance
      • pytorch
      • qe
      • qmcpack
      • quadray
      • quantlib
      • quicksilver
      • ramspeed
      • rav1e
      • rawtherapee
      • rays1bench
      • rbenchmark
      • redis
      • renaissance
      • rnnoise
      • rocksdb
      • rodinia
      • rsvg
      • schbench
      • scikit-learn
      • scimark2
      • scylladb
      • securemark
      • selenium
      • simdjson
      • smallpt
      • smhasher
      • spark
      • spark-tpcds
      • specfem3d
      • speedb
      • sqlite
      • srsran
      • stargate
      • stockfish
      • stream
      • stress-ng
      • sudokut
      • svt-av1
      • svt-hevc
      • svt-vp9
      • synthmark
      • sysbench
      • tensorflow
      • tensorflow-lite
      • tesseract
      • tjbench
      • tnn
      • toybrot
      • tscp
      • ttsiod-renderer
      • tungsten
      • uvg266
      • v-ray
      • vkpeak
      • vpxenc
      • vvenc
      • webp
      • webp2
      • whisper.cpp
      • whisperfile
      • wireguard
      • x264
      • x265
      • xmrig
      • xnnpack
      • y-cruncher
      • z3
    • stream
  • Tools
    • Compilers
    • likwid
    • perf
    • trace-cmd and kernelshark
    • wspy
  • Experiments
Home→Published 2023

Yearly Archives: 2023

Creating basic metrics and adding topdown plots

Performance analysis, tools and experiments Posted on December 31, 2023 by mevDecember 31, 2023

I have made several enhancements to the topdown tool. I also have some fragile things I still need to sort out along the way.

  • I have added metrics for –topdown2, –cache2, –float –branch and –opcache. These behave as I expect on AMD systems. I am still sorting out things on Intel system, though something acts strange with my topdown2 counters. If I use them alone, all is well but when I combine them with other counters, the perf_event_open call tells me there is an invalid argument.
  • I have done a first implementation of level 1 caches (–dcache,–icache) and TLB (–tlb). All these use the PERF_TYPE_HW_CACHE type from perf_event_open(2). However, the results don’t quite seem right – so I may look at adding corresponding events with PERF_TYPE_RAW events and see if they make more sense.
  • I did an initial implementation for –memory using the LS core counters for memory operations. This is also used for local/remote memory for likwid. However, the numbers are lower than what stream reports for memory traffic, so not sure this is the right counter recipe. I also have references to the /sys/devices/amd_df counters and can see them after loading the driver. However, not quite sure what counter to use for memory channel read/writes
  • I have created an initial summary block “topdown.txt” for counters that work as I expect and have both for AMD and Intel processors a high level summary I will show below.
  • I have implemented the “–interval” option which lets me sample counters periodically. When combined with gnuplot, –csv and -o options this lets me create some *.png files that plot topdown metrics.

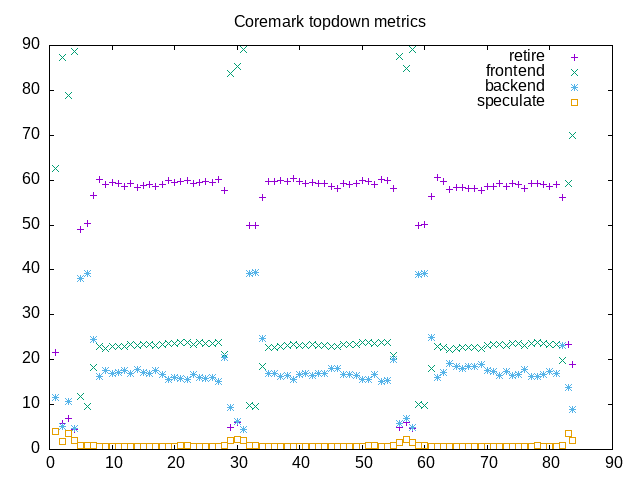
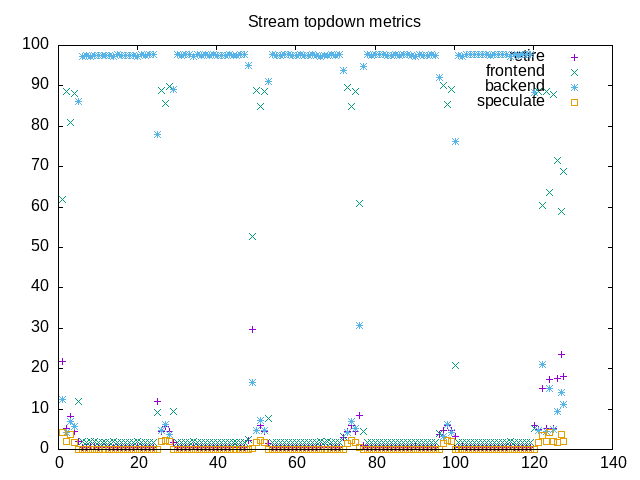
The net combination is best seen below where I include both a topdown metrics summary (created from three runs of “topdown” with different options) and a topdown chart (created from a fourth run with additional options). This is a fair step along the way towards having a basic analysis tool for looking at benchmark loads. In addition to clearing up some of the issues above, I also want to add a “–tree” option to plot a process tree. Once I have that, I’ll have most of the useful bits of the program formerly named “wspy” and might also rename my “topdown” to also accept the “wspy” name.

Here is an AMD summary block with major that includes metrics for coremark:

elapsed              83.410
on_cpu               0.747          # 11.95 / 16 cores
utime                996.029
stime                0.451
nvcsw                1162           # 12.25%
nivcsw               8320           # 87.75%
inblock              0
onblock              1096
cpu-clock            996492501279   # 996.493 seconds
task-clock           996497240698   # 996.497 seconds
page faults          49987          # 50.163/sec
context switches     9695           # 9.729/sec
cpu migrations       136            # 0.136/sec
major page faults    0              # 0.000/sec
minor page faults    49985          # 50.161/sec
alignment faults     0              # 0.000/sec
emulation faults     0              # 0.000/sec
branches             1905721388306  # 189.110 branches per 1000 inst
branch misses        3005711443     # 0.16% branch miss
conditional          1674633740961  # 166.178 conditional branches per 1000 inst
indirect             9422915848     # 0.935 indirect branches per 1000 inst
cpu-cycles           4319923640733  # 3.23 GHz
instructions         10080742579393 # 2.33 IPC
slots                8640874657662  #
retiring             3015427410903  # 34.9% (58.9%)
-- ucode             6726058        #     0.0%
-- fastpath          3015420684845  #    34.9%
frontend             1175050211309  # 13.6% (22.9%)
-- latency           530224174536   #     6.1%
-- bandwidth         644826036773   #     7.5%
backend              894468621667   # 10.4% (17.5%)
-- cpu               270749606784   #     3.1%
-- memory            623719014883   #     7.2%
speculation          36309001429    #  0.4% ( 0.7%)
-- branch mispredict 34321580391    #     0.4%
-- pipeline restart  1987421038     #     0.0%
smt-contention       3519610791947  # 40.7% ( 0.0%)
instructions         5040563575655  # 0.024 l2 access per 1000 inst
l2 hit from l1       114170557      # 8.80% l2 miss
l2 miss from l1      7864844        #
l2 hit from l2 pf    5961997        #
l3 hit from l2 pf    1759222        #
l3 miss from l2 pf   1202870        #
instructions         5036908689193  # 0.085 float per 1000 inst
float 512            92             # 0.000 AVX-512 per 1000 inst
float 256            852            # 0.000 AVX-256 per 1000 inst
float 128            427687605      # 0.085 AVX-128 per 1000 inst
float MMX            0              # 0.000 MMX per 1000 inst
float scalar         0              # 0.000 scalar per 1000 inst

Here is the corresponding Intel summary block, also for coremark:

elapsed              82.626
on_cpu               0.707          # 11.31 / 16 cores
utime                934.350
stime                0.259
nvcsw                1122           # 16.56%
nivcsw               5653           # 83.44%
inblock              0
onblock              1064
cpu-clock            934609836035   # 934.610 seconds
task-clock           934612788300   # 934.613 seconds
page faults          74644          # 79.866/sec
context switches     6966           # 7.453/sec
cpu migrations       190            # 0.203/sec
major page faults    0              # 0.000/sec
minor page faults    74644          # 79.866/sec
alignment faults     0              # 0.000/sec
emulation faults     0              # 0.000/sec
branches             1487191047680  # 189.103 branches per 1000 inst
branch misses        3750608715     # 0.25% branch miss
conditional          1487191057952  # 189.103 conditional branches per 1000 inst
indirect             441335072192   # 56.118 indirect branches per 1000 inst
slots                6076449129938  #
retiring             3906991250131  # 64.3% (64.3%)
-- ucode             67666336195    #     1.1%
-- fastpath          3839324913936  #    63.2%
frontend             1246450345074  # 20.5% (20.5%)
-- latency           751572503238   #    12.4%
-- bandwidth         494877841836   #     8.1%
backend              629022362428   # 10.4% (10.4%)
-- cpu               335343935853   #     5.5%
-- memory            293678426575   #     4.8%
speculation          272715027078   #  4.5% ( 4.5%)
-- branch mispredict 256635566653   #     4.2%
-- pipeline restart  16079460425    #     0.3%
smt-contention       0              #  0.0% ( 0.0%)
cpu-cycles           3907422305230  # 2.65 GHz
instructions         9072449306543  # 2.32 IPC
l2 access            130609511      # 0.029 l2 access per 1000 inst
l2 miss              41959615       # 32.13% l2 miss

Here is the plot file of topdown metrics for coremark followed by the one for stream. From here you can see the repetition with different benchmarks as well as how the overall pattern (backend bound stream, mostly retiring coremark) show together.

Posted in Tools | Tagged gnuplot, performance counters, topdown | Leave a reply

Turning on counters for l3 and data fabric measurements on AMD

Performance analysis, tools and experiments Posted on December 29, 2023 by mevDecember 29, 2023

By default, counters were not available to measure l3 and df counters on AMD. With some help from likwid documentation I figured out what is going on and how to get it enabled.

The first thing to do is see if the perf subsystem knows about l3 and df areas. This can be done by doing

prompt% ls /sys/devices/*/format
/sys/devices/amd_iommu_0/format:
csource  devid  devid_mask  domid  domid_mask  pasid  pasid_mask

/sys/devices/cpu/format:
cmask  edge  event  inv  umask

/sys/devices/ibs_fetch/format:
l3missonly  rand_en

/sys/devices/ibs_op/format:
cnt_ctl  l3missonly

/sys/devices/kprobe/format:
retprobe

/sys/devices/msr/format:
event

/sys/devices/power/format:
event

/sys/devices/uprobe/format:
ref_ctr_offset  retprobe

Only devices that are available will show up here. My example is missing, so next one needs to see what is compiled into the running kernel. This can be done by doing:

prompt% /home/mev/source/wspy# grep -i perf_events /boot/config-$(uname -r)
CONFIG_HAVE_PERF_EVENTS=y
CONFIG_GUEST_PERF_EVENTS=y
CONFIG_PERF_EVENTS=y
CONFIG_PERF_EVENTS_INTEL_UNCORE=y
CONFIG_PERF_EVENTS_INTEL_RAPL=m
CONFIG_PERF_EVENTS_INTEL_CSTATE=m
# CONFIG_PERF_EVENTS_AMD_POWER is not set
CONFIG_PERF_EVENTS_AMD_UNCORE=m
CONFIG_PERF_EVENTS_AMD_BRS=y
CONFIG_HAVE_PERF_EVENTS_NMI=y
CONFIG_SECURITY_PERF_EVENTS_RESTRICT=y

The l3 and df counters are uncore counters and can be loaded as a module. So we load this module using the following command

prompt% /home/mev/source/wspy# insmod /lib/modules/$(uname -r)/kernel/arch/x86/events/amd/amd-uncore.ko

This loads the module and the command above shows /sys/devices/amd_l3/format and /sys/devices/amd_df/format. Once this is enabled, the perf list command can give relevant counters. The command and useful parts of the output are included below:

prompt% perf list -v --detail
l3_cache:
  l3_cache_accesses
       [l3_lookup_state.all_coherent_accesses_to_l3]
  l3_misses
       [l3_lookup_state.l3_miss]
  l3_read_miss_latency
       [l3_xi_sampled_latency.all * 10 / l3_xi_sampled_latency_requests.all]

Now using “perf stat” we can try the l3 counters and make sure they work.

prompt% perf stat -e l3_lookup_state.all_coherent_accesses_to_l3,l3_lookup_state.l3_hit /bin/ls
cpumask  format  perf_event_mux_interval_ms  power  subsystem  type  uevent

 Performance counter stats for 'system wide':

            80,264      l3_lookup_state.all_coherent_accesses_to_l3                                      
            70,798      l3_lookup_state.l3_hit                                                

       0.001688959 seconds time elapsed

What remains is figuring out the right “config” flags to make the equivalent call to perf_event_open. We can look these up with strace. This tells me the type field for the struct perf_event_attr is 0xe. This also happens to be shown in /sys/devices/amd_l3/type file. I can figure this out for l3 access but not quite sure which event to use for the data fabric to measure memory.

Success!

Posted in experiment | Tagged data fabric, kernel, l3, perf, performance counters | Leave a reply

Potential interface and potential counter groups for topdown tool

Performance analysis, tools and experiments Posted on December 25, 2023 by mevDecember 25, 2023

I have looked through the Family 19h PPR reference, output from “perf list -v –detail” and also some likwid counter groups to figure out combinations of counters I might be able to add as instrumentation options for a topdown command. Based on these, I have a potential combination of options to consider and a mocked up usage model as follows:

./topdown: invalid option -- '?'
warning: unknown option: ?
fatal error: usage: ./topdown -[abcistv][-o <file>] <cmd><args>...
	--per-core or -a          - metrics per core
	--rusage or -r            - show getrusage(2) information
	--tree                    - print process tree
	-o <file>                 - send output to file
	--csv                     - create csv output
	--verbose or -v           - print verbose information

	--software or -s          - software counters
	--ipc or i                - IPC counters
	--branch or -b            - branch counters
	--dcache                  - L1 dcache counters
	--icache                  - L1 icache counters
	--cache2 or -c            - L2 cache counters
	--cache3                  - L3 cache counters
	--memory                  - memory counters
	--opcache                 - opcache counters
	--tlb                     - TLB counters
	--topdown or -t           - topdown counters, level 1
	--topdown2                - topdown counters, level 2

The first section is more generic control, e.g. CSV vs tabular, redirected to a file, all cores together vs. core by core, etc. The section below that are all various combinations of performance counters (typically five or less so we don’t need to multiplex just that option. These include the software, topdown and ipc metrics I’ve already implemented and then the following examples:

  • branch miss rate and frequency branches occur
  • dcache – L1 data cache rates and miss percentage
  • icache – L1 icache rates and misses
  • cache2 – L2 cache rates and misses
  • cache3 – L3 cache rates and misses
  • opcache – op cache rates and misses
  • memory – memory bandwidth counters
  • tlb – TLB misses for both ITLB and DTLB
  • topdown – topdown level 1 metrics – standardized with Intel and AMD into <retiring, frontend, backend and bad-speculation>; this means taking the smt-contention out of the calculation on AMD
  • topdown2 – topdown level 2 metrics; bring back SMT contention and then go the next level: frontend bandwith vs. latency, backend cpu vs. memory, speculation mispredict vs. machine clears and retiring heavy ops vs light ops.

This now gives me a set to slowly look at implementing and adding to the topdown tool.

Posted in Tools | Tagged performance counters, topdown | Leave a reply

topdown – updated tool and metrics

Performance analysis, tools and experiments Posted on December 23, 2023 by mevDecember 23, 2023

I have updated and enhanced the topdown tool and also used this as an occasion to explore Zen4 topdown performance counters, Intel hybrid CPU while building something to compare Intel i5-13500H and Ryzen 7940 processor metrics. The interface might change, … Continue reading →

Posted in Tools | Tagged getrusage, perf_event_open, performance counters | Leave a reply

New i5-13500H machine

Performance analysis, tools and experiments Posted on December 19, 2023 by mevDecember 19, 2023

I have set up a new Intel performance machine for experiments. The processor is a i5-13500H in a Geekom MiniIT13 mini-PC. Following are some of the major parameters. This comparison is with Ryzen 7840 which will be my AMD comparison … Continue reading →

Posted in hardware | Tagged i5-13500H | Leave a reply

New Ryzen 7840 machine

Performance analysis, tools and experiments Posted on December 17, 2023 by mevDecember 17, 2023

I have set up a new AMD performance machine for experiments. The processors is a Ryzen 7840 (Phoenix) in a Beelink SER7 mini-PC. Following are some of the major parameters. This comparison is with Intel i5-13500H which will be my … Continue reading →

Posted in hardware | Tagged 7840HS | Leave a reply

Stream, experiments

Performance analysis, tools and experiments Posted on December 16, 2023 by mevDecember 17, 2023

I copied Stream from https://www.cs.virginia.edu/stream/ and put a copy in https://github.com/cycletourist/perf. This suggested the following compilation flags On my system with a Ryzen 7 7800X3D this results in the following performance: The question is what is the sensitivity of various … Continue reading →

Posted in experiment | Tagged stream | Leave a reply

Performance Counters required to compute topdown metrics

Performance analysis, tools and experiments Posted on February 23, 2023 by mevFebruary 23, 2023

From past work, we know the five counters required to compute the first level topdown metrics on Intel processors: CLK_UNHALTED_CORE = 0x00 IDQ_UOPS_NOT_DELIVERED_CORE = 0x9C, umask=1 UOPS_RETIRED_RETIRE_SLOTS = 0xC2, umask=2 UOPS_ISSUED_ANY = 0x0E, umask=1 INT_MISC_RECOVERY_CYCLES = 0x0d, umask=3, cmask=1 These … Continue reading →

Posted in hardware | Tagged perf, performance counters, topdown | Leave a reply

perf – new performance counters with Linux 6.2

Performance analysis, tools and experiments Posted on February 22, 2023 by mevFebruary 22, 2023

It looks like there are many new capabilities in the linux perf command run on a Zen4 core under Linux 6.2 when compared with Zen1 core under Linux 5.4. I compared the “perf list” output between: Ubuntu 20.04, Linux 5.4, … Continue reading →

Posted in Tools | Tagged perf | Leave a reply

New website

Performance analysis, tools and experiments Posted on February 21, 2023 by mevFebruary 21, 2023

Back in 2018, I set up a website at perf.mvermeulen.com to document my explorations of performance topics. This website is continuing that tradition but providing a new location including using the central administration and https certificate from mvermeulen.org. Otherwise I … Continue reading →

Posted in website | Tagged website | Leave a reply

Meta

  • Log in
  • Entries feed
  • Comments feed
  • WordPress.org

Archives

  • November 2024
  • October 2024
  • September 2024
  • July 2024
  • June 2024
  • March 2024
  • February 2024
  • January 2024
  • December 2023
  • February 2023

Tags

7840HS bad data benchmarks cachyos cluster compiler coremark cpu2017 data fabric getrusage gnuplot i5-13500H icache ipc kernel l3 metrics namd opcache perf performance counters perf_event_open phoronix Ryzen AI 9 HX 370 Ryzen AI 365 scaling stream threshold topdown tree virtualization website wsl Zen5

Recent Posts

  • Virtualization comparisons
  • Updating to a new kernel and graphics driver
  • SPEC CPU2017 Ryzen AI HX 370 vs. Ryzen 7840 HS
  • phoronix – Ryzen AI HX 370 vs Ryzen 7840 HS
  • New Ryzen AI 9 HX 370 machine
©2026 - Performance analysis, tools and experiments - Weaver Xtreme Theme
↑