↓
 

Performance analysis, tools and experiments

An eclectic collection

  • Overview
  • Blog
  • Workloads
    • cpu2017
      • 500.perlbench_r
      • 502.gcc_r
      • 503.bwaves_r
      • 505.mcf_r
      • 507.cactuBSSN_r
      • 508.namd_r
      • 510.parest_r
      • 511.povray_r
      • 519.lbm_r
      • 520.omnetpp_r
      • 521.wrf_r
      • 523.xalancbmk_r
      • 525.x264_r
      • 526.blender_r
      • 527.cam4_r
      • 531.deepsjeng_r
      • 538.imagick_r
      • 541.leela_r
      • 544.nab_r
      • 548.exchange2_r
      • 549.fotonik3d_r
      • 554.roms_r
      • 557.xz_r
    • geekbench
    • lmbench
    • passmark
    • pbbs
    • phoronix
      • ai-benchmark
      • aircrack-ng
      • amg
      • aobench
      • aom-av1
      • apache
      • apache-iotdb
      • appleseed
      • arrayfire
      • askap
      • asmfish
      • astcenc
      • avifenc
      • basis
      • blake2
      • blogbench
      • blender
      • blosc
      • bork
      • botan
      • brl-cad
      • build-apache
      • build-clash
      • build-eigen
      • build-erlang
      • build-ffmpeg
      • build-gcc
      • build-gdb
      • build-gem5
      • build-godot
      • build-imagemagick
      • build-linux-kernel
      • build-llvm
      • build-mesa
      • build-mplayer
      • build-nodejs
      • build-php
      • build-python
      • build-wasmer
      • build2
      • bullet
      • byte
      • cachebench
      • cassandra
      • clickhouse
      • clomp
      • cloverleaf
      • cockroach
      • compilebench
      • compress-7zip
      • compress-gzip
      • compress-lz4
      • compress-pbzip2
      • compress-rar
      • compress-xz
      • compress-zstd
      • core-latency
      • coremark
      • cp2k
      • cpp-perf-bench
      • cpuminer-opt
      • crafty
      • c-ray
      • cryptopp
      • cryptsetup
      • ctx-clock
      • cython-bench
      • dacapobench
      • daphne
      • darktable
      • dav1d
      • dbench
      • deepsparse
      • deepspeech
      • dolfyn
      • draco
      • dragonflydb
      • duckdb
      • easywave
      • ebizzy
      • embree
      • encode-flac
      • encode-mp3
      • encode-opus
      • encode-wavpack
      • espeak
      • etcpak
      • faiss
      • fast-cli
      • ffmpeg
      • ffte
      • fftw
      • fhourstones
      • financebench
      • furmark
      • gcrypt
      • gegl
      • gimp
      • git
      • glibc-bench
      • gmpbench
      • gnupg
      • gnuradio
      • go-benchmark
      • gpaw
      • graph500
      • graphics-magick
      • gromacs
      • hackbench
      • hadoop
      • heffte
      • helsing
      • himeno
      • hmmer
      • hpcg
      • incompact3d
      • indigobench
      • inkscape
      • ipc-benchmark
      • java-jmh
      • java-scimark2
      • john-the-ripper
      • jpegxl
      • jpegxl-decode
      • kvazaar
      • kripke
      • lammps
      • lczero
      • libraw
      • libreoffice
      • libxsmm
      • liquid-dsp
      • llama.cpp
      • llamafile
      • lulesh
      • lzbench
      • mbw
      • memcached
      • minibude
      • minife
      • mnn
      • mpcbench
      • m-queens
      • mrbayes
      • mutex
      • namd
      • mt-dgemm
      • ncnn
      • neat
      • nettle
      • nginx
      • ngspice
      • node-octane
      • node-web-tooling
      • npb
      • n-queens
      • numpy
      • nwchem
      • oidn
      • onednn
      • octave-benchmark
      • onnx
      • opencv
      • openfoam
      • openjpeg
      • openssl
      • openradioss
      • openscad
      • openvino
      • openvkl
      • ospray
      • ospray-studio
      • palabos
      • parboil
      • pennant
      • perl-benchmark
      • pgbench
      • phpbench
      • pjsip
      • polybench-c
      • polyhedron
      • povray
      • primesieve
      • pybench
      • pyhpc
      • pyperformance
      • pytorch
      • quadray
      • qe
      • qmcpack
      • quantlib
      • quicksilver
      • ramspeed
      • rav1e
      • rawtherapee
      • rbenchmark
      • redis
      • renaissance
      • rnnoise
      • rocksdb
      • rodinia
      • rsvg
      • schbench
      • scikit-learn
      • scimark2
      • scylladb
      • securemark
      • selenium
      • simdjson
      • smallpt
      • smhasher
      • spark
      • spark-tpcds
      • speedb
      • specfem3d
      • sqlite
      • srsran
      • stargate
      • stockfish
      • stream
      • stress-ng
      • svt-av1
      • svt-hevc
      • svt-vp9
      • sudokut
      • synthmark
      • sysbench
      • tensorflow
      • tensorflow-lite
      • tesseract
      • tjbench
      • tnn
      • toybrot
      • tscp
      • ttsiod-renderer
      • tungsten
      • uvg266
      • vkpeak
      • vpxenc
      • v-ray
      • vvenc
      • webp
      • webp2
      • whisper.cpp
      • whisperfile
      • wireguard
      • x264
      • x265
      • xmrig
      • xnnpack
      • y-cruncher
      • z3
    • stream
  • Tools
    • Compilers
    • likwid
    • perf
    • trace-cmd and kernelshark
    • wspy
  • Experiments
    • Histograms
    • clustering
    • Adding summary statistics for all benchmarks
  • Home
  • Blog
  • Workloads
    • cpu2017
      • 500.perlbench_r
      • 502.gcc_r
      • 503.bwaves_r
      • 505.mcf_r
      • 507.cactuBSSN_r
      • 508.namd_r
      • 510.parest_r
      • 511.povray_r
      • 519.lbm_r
      • 520.omnetpp_r
      • 521.wrf_r
      • 523.xalancbmk_r
      • 525.x264_r
      • 526.blender_r
      • 527.cam4_r
      • 531.deepsjeng_r
      • 538.imagick_r
      • 541.leela_r
      • 544.nab_r
      • 548.exchange2_r
      • 549.fotonik3d_r
      • 554.roms_r
      • 557.xz_r
    • geekbench
    • lmbench
    • passmark
    • pbbs
    • phoronix
      • ai-benchmark
      • aircrack-ng
      • amg
      • aobench
      • aom-av1
      • apache
      • apache-iotdb
      • appleseed
      • arrayfire
      • askap
      • asmfish
      • astcenc
      • avifenc
      • b
      • basis
      • blake2
      • blender
      • blogbench
      • blosc
      • bork
      • botan
      • brl-cad
      • build-apache
      • build-clash
      • build-eigen
      • build-erlang
      • build-ffmpeg
      • build-gcc
      • build-gdb
      • build-gem5
      • build-godot
      • build-imagemagick
      • build-linux-kernel
      • build-llvm
      • build-mesa
      • build-mplayer
      • build-nodejs
      • build-php
      • build-python
      • build-wasmer
      • build2
      • bullet
      • byte
      • c-ray
      • cachebench
      • cassandra
      • clickhouse
      • clomp
      • cloverleaf
      • cockroach
      • compilebench
      • compress-7zip
      • compress-gzip
      • compress-lz4
      • compress-pbzip2
      • compress-rar
      • compress-xz
      • compress-zstd
      • core-latency
      • coremark
      • cp2k
      • cpp-perf-bench
      • cpuminer-opt
      • crafty
      • cryptopp
      • cryptsetup
      • ctx-clock
      • cython-bench
      • dacapobench
      • daphne
      • darktable
      • dav1d
      • dbench
      • deepsparse
      • deepspeech
      • dolfyn
      • draco
      • dragonflydb
      • duckdb
      • easywave
      • ebizzy
      • embree
      • encode-flac
      • encode-mp3
      • encode-opus
      • encode-wavpack
      • espeak
      • etcpak
      • faiss
      • fast-cli
      • ffmpeg
      • ffte
      • fftw
      • fhourstones
      • financebench
      • furmark
      • gcrypt
      • gegl
      • gimp
      • git
      • glibc-bench
      • gmpbench
      • gnupg
      • gnuradio
      • go-benchmark
      • gpaw
      • graph500
      • graphics-magick
      • gromacs
      • hackbench
      • hadoop
      • heffte
      • helsing
      • himeno
      • hmmer
      • hpcg
      • incompact3d
      • indigobench
      • inkscape
      • ipc-benchmark
      • java-jmh
      • java-scimark2
      • john-the-ripper
      • jpegxl
      • jpegxl-decode
      • kripke
      • kvazaar
      • lammps
      • lczero
      • libraw
      • libreoffice
      • libxsmm
      • liquid-dsp
      • llama.cpp
      • llamafile
      • lulesh
      • lzbench
      • m-queens
      • mbw
      • memcached
      • minibude
      • minife
      • mnn
      • mpcbench
      • mrbayes
      • mt-dgemm
      • mutex
      • n-queens
      • namd
      • ncnn
      • neat
      • nettle
      • nginx
      • ngspice
      • node-octane
      • node-web-tooling
      • npb
      • numpy
      • nwchem
      • octave-benchmark
      • oidn
      • onednn
      • onnx
      • opencv
      • openfoam
      • openjpeg
      • openradioss
      • openscad
      • openssl
      • openvino
      • openvkl
      • ospray
      • ospray-studio
      • palabos
      • parboil
      • pennant
      • perl-benchmark
      • pgbench
      • phpbench
      • pjsip
      • polybench-c
      • polyhedron
      • povray
      • primesieve
      • pybench
      • pyhpc
      • pyperformance
      • pytorch
      • qe
      • qmcpack
      • quadray
      • quantlib
      • quicksilver
      • ramspeed
      • rav1e
      • rawtherapee
      • rays1bench
      • rbenchmark
      • redis
      • renaissance
      • rnnoise
      • rocksdb
      • rodinia
      • rsvg
      • schbench
      • scikit-learn
      • scimark2
      • scylladb
      • securemark
      • selenium
      • simdjson
      • smallpt
      • smhasher
      • spark
      • spark-tpcds
      • specfem3d
      • speedb
      • sqlite
      • srsran
      • stargate
      • stockfish
      • stream
      • stress-ng
      • sudokut
      • svt-av1
      • svt-hevc
      • svt-vp9
      • synthmark
      • sysbench
      • tensorflow
      • tensorflow-lite
      • tesseract
      • tjbench
      • tnn
      • toybrot
      • tscp
      • ttsiod-renderer
      • tungsten
      • uvg266
      • v-ray
      • vkpeak
      • vpxenc
      • vvenc
      • webp
      • webp2
      • whisper.cpp
      • whisperfile
      • wireguard
      • x264
      • x265
      • xmrig
      • xnnpack
      • y-cruncher
      • z3
    • stream
  • Tools
    • Compilers
    • likwid
    • perf
    • trace-cmd and kernelshark
    • wspy
  • Experiments
Home→Tags performance counters

Tag Archives: performance counters

phoronix – Ryzen AI HX 370 vs Ryzen 7840 HS

Performance analysis, tools and experiments Posted on October 10, 2024 by mevOctober 18, 2024

As a follow up comparison of Ryzen AI HX 370 processor compared to Ryzen 7840 HS, this posting looks at some Phoronix benchmarks.

I’ve run more than 200 Phoronix benchmarks in analysis using performance counters. I use these clusters to guide the benchmarks chosen trying to pick one from each cluster. In some cases where the benchmark didn’t easily run on Ubuntu 24.04, I skipped to another benchmark rather than debug the original issue. A cluster list from September 2024 below:

Cluster 0 (10 entries): 505.mcf_r 531.deepsjeng_r appleseed asmfish avifenc blender ospray primesieve stockfish v-ray
Cluster 1 (3 entries): 520.omnetpp_r amg compress-xz
Cluster 2 (7 entries): 500.perlbench_r 525.x264_r 544.nab_r brl-cad quicksilver smallpt vvenc
Cluster 3 (10 entries): aom-av1 cp2k neat openradioss qmcpack srsran svt-av1 vpxenc x264 x265
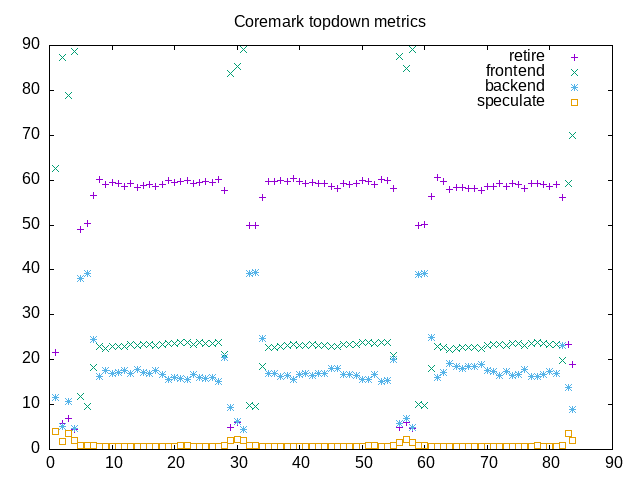
Cluster 4 (14 entries): 538.imagick_r 548.exchange2_r astcenc basis coremark cpuminer-opt kvazaar mrbayes quantlib rav1e rays1bench toybrot uvg266 webp2
Cluster 5 (10 entries): blake2 build-apache build-clash build-eigen octave-benchmark openjpeg selenium tscp tungsten vkpeak
Cluster 6 (19 entries): build2 build-ffmpeg build-gcc build-gdb build-gem5 build-godot build-linux-kernel build-llvm build-mesa build-mplayer build-nodejs build-\
wasmer hackbench helsing mnn rocksdb scylladb speedb stress-ng
Cluster 7 (5 entries): bork byte openscad phpbench sudokut
Cluster 8 (10 entries): aobench compress-lz4 crafty fhourstones git gnupg lammps lzbench tjbench webp
Cluster 9 (11 entries): apache-iotdb compress-zstd core-latency cpp-perf-bench draco encode-wavpack fftw jpegxl polybench-c polyhedron z3
Cluster 10 (10 entries): botan cachebench cryptsetup gcrypt glibc-bench gnuradio java-scimark2 nettle simdjson synthmark
Cluster 11 (7 entries): duckdb inkscape libreoffice node-web-tooling numpy perl-benchmark rsvg
Cluster 12 (15 entries): bullet compress-pbzip2 cython-bench encode-flac encode-mp3 encode-opus etcpak ffmpeg hmmer libraw node-octane pyperformance rnnoise scim\
ark2 stargate
Cluster 13 (7 entries): build-python compress-gzip compress-rar dacapobench gegl hadoop spark-tpcds
Cluster 14 (10 entries): 508.namd_r 511.povray_r aircrack-ng c-ray graphics-magick java-jmh namd povray rodinia svt-hevc
Cluster 15 (7 entries): askap hpcg incompact3d onnx parboil pytorch whisperfile
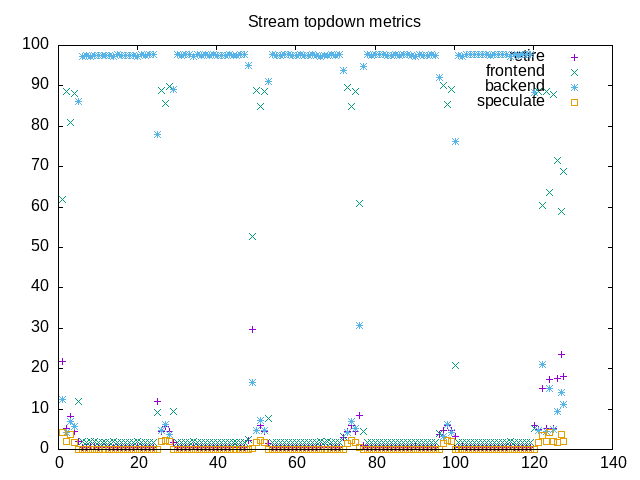
Cluster 16 (15 entries): 503.bwaves_r 507.cactuBSSN_r 510.parest_r 519.lbm_r 521.wrf_r 549.fotonik3d_r 554.roms_r cloverleaf easywave kripke mt-dgemm ncnn stream\
 tensorflow xmrig
Cluster 17 (8 entries): darktable deepsparse ffte llama.cpp llamafile npb openfoam palabos
Cluster 18 (4 entries): 541.leela_r compress-7zip m-queens n-queens
Cluster 19 (7 entries): clomp deepspeech heffte himeno lulesh ngspice ramspeed
Cluster 20 (11 entries): 523.xalancbmk_r ai-benchmark libxsmm minibude oidn onednn openvino quadray tensorflow-lite xnnpack y-cruncher
Cluster 21 (4 entries): 502.gcc_r 527.cam4_r ebizzy faiss
Cluster 22 (5 entries): blosc dragonflydb mbw minife pjsip
Cluster 23 (4 entries): john-the-ripper openssl qe specfem3d
Cluster 24 (6 entries): arrayfire build-erlang build-imagemagick build-php nginx rbenchmark
Cluster 25 (11 entries): cryptopp dolfyn espeak gmpbench mpcbench mutex nwchem pybench securemark smhasher spark
Cluster 26 (12 entries): apache cassandra cockroach compilebench ctx-clock dbench fast-cli ipc-benchmark memcached pgbench sqlite wireguard
Cluster 27 (11 entries): clickhouse daphne dav1d gimp indigobench jpegxl-decode opencv pyhpc renaissance schbench svt-vp9
Cluster 28 (9 entries): 526.blender_r 557.xz_r embree graph500 lczero openvkl ospray-studio sysbench ttsiod-renderer
Cluster 29 (8 entries): financebench gpaw gromacs liquid-dsp pennant rawtherapee tnn whisper.cpp

Following is a summary of the benchmarks followed by some observations

clusterbenchmarkmetric ratio7840 metrichx 370 metric7840 on cpuhx 370 on cpu7840 retirehx 370 retire7840 frontendhx 370 frontend7840 backendhx 370 backend7840 speculationhx 370 speculation
0ospray1.583.87314 / second6.07719 /sec14.4621.2829.3%30.7%27.3%11.8%41.1%54.2%2.3%2.4%
1compress-xz0.9628.665 seconds29.736 seconds11.0412.458.2%7.3%10.2%17.3%76.5%68.2%5.1%7.1%
2quicksilver1.4112610000 fom1776333 fom15.3819.9%49.8%15.9%6.9%15.9%38.9%59.5%4.4%2.7%
3x2651.6513.79 frames/second22.81 frames/sec7.7211.6235.0%26.9%14.3%22.5%48.0%47.4%2.7%3.0%
4coremark1.37411227 iterations/sec561065 iterations/sec11.9814.4345.7%37.0%39.7%42.0%14.2%20.2%0.3%0.8%
5build-eigen0.7763.356 seconds82.516 seconds0.930.9425.2%20.4%50.5%52.8%18.6%21.9%5.6%4.8%
6build-gcc1.061038.166 seconds976.243 seconds9.9810.9124.1%18.3%51.5%60.0%19.7%18.2%4.7%3.1%
7phpbench0.771159425 score900908 score0.800.8361.2%48.6%23.0%30.1%15.0%20.1%0.8%1.1%
8lzbench0.58192 MB/s111 MB/s0.800.8234.1%22.7%26.3%36.5%21.5%21.2%18.1%19.4%
9compress-zstd1.011534.8 MB/s1556.6 MB/s4.233.4521.4%18.3%9.5%17.8%62.8%55.7%6.3%0.2%
10simdjson0.795.58 GB/s4.41 GB/s0.930.9450.4%42.7%13.1%27.0%33.2%28.0%3.3%1.5%
11perl-benchmark0.780.068363375 seconds0.08713901 seconds0.930.9243.0%35.5%41.8%41.7%11.1%18.0%4.2%4.6%
12ffmpeg0.99252.66 fps251.11 fps3.672.6132.3%29.1%18.4%30.3%29.0%33.8%5.6%6.7%
13compress-gzip0.6928.116 seconds40.597 seconds0.960.9519.9%15.1%26.4%29.1%42.0%43.0%11.7%12.7%
14povray1.3438.681 seconds28.778 seconds13.3218.8331.8%40.1%3.5%16.3%25.5%41.5%1.3%2.0%
15whisperfile1.1154.13398 seconds48.57337 seconds7.4410.8120.0%15.2%2.2%15.5%77.3%68.9%0.3%0.3%
16easywave1.268.809 seconds7.005 seconds14.6020.534.5%4.8%3.1%15.1%83.6%74.6%0.1%0.1%
17darktable1.345.711 seconds4.267 seconds3.425.5027.9%19.1%7.2%15.2%63.5%60.9%1.3%1.0%
18compress-7zip1.0176676 MIPS77409 MIPS12.0317.2721.5%13.0%38.6%53.5%29.1%19.7%10.8%13.8%
19himeno1.074447 MFLOPS4769 MFLOPS0.910.9126.4%33.3%2.5%2.7%71.0%63.7%0.2%0.3%
20minibude1.36537.395 GFinst/s733.427 GFInst/s15.3620.5119.8%18.7%0.3%1.6%79.8%79.0%0.1%0.4%
21ebizzy0.18774839 records/s140179 records/s12.8719.827.3%0.6%35.3%63.1%57.3%36.3%0.0%0.0%
22pjsip0.794613 response/sec3665 response/sec2.402.2312.2%11.3%38.4%33.9%48.4%51.3%1.1%1.1%
23openssl1.6315219867520 bytes/s17696663040 bytes/s15.5123.2546.5%33.4%4.9%13.3%48.7%53.2%0.0%0.0%
24build-php1.1667.052 seconds65.354 seconds8.3010.2020.8%15.1%50.4%57.0%24.8%24.1%3.9%3.4%
25pybench0.84554 ms663 ms0.750.7970.1%63.9%15.9%17.0%11.4%17.0%2.6%2.1%
26dbench3.74687.037 MB/s2573 MB/s1.052.0619.4%22.2%70.0%38.3%9.9%37.5%0.7%0.9%
27indigobench1.402.090 samples/sec2.917 samples/sec14.1421.2525.8%19.9%14.8%29.3%54.0%44.9%5.4%5.4%
28lczero1.41108 nodes/sec152 nodes/sec13.2318.3416.8%14.3%4.4%3.8%78.7%81.6%0.1%0.1%
29rawtherapee1.0554.194 seconds51.600 seconds7.7110.1929.0%18.5%12.6%27.1%57.0%44.8%1.5%1.3%

The first observation is most all single-threaded benchmarks run faster on the 7840 than on the Strix 370. In contrast the largest differences are among those with largest number of “on_cpu” threads.

There are two outliers that deserve a second look:

  • ebizzy is over 5x faster on 7840 than hx 370. This benchmark runs quickly so need to make sure it is running correctly in both instances. I don’t see these ratios in the two SPEC CPU2017 benchmarks also part of this group.
  • dbench runs over 3x faster on hx370 than 7840. The on_cpu is almost twice. Again useful to understand if there is another influence affecting this benchmark. Perhaps this one testing something else.
Posted in experiment | Tagged 7840HS, performance counters, phoronix, Ryzen AI 9 HX 370 | Leave a reply

wsl and performance counters?

Performance analysis, tools and experiments Posted on July 30, 2024 by mevJuly 30, 2024

I have seen some references that it might be possible to have performance counters in WSL, like this page.

If I type

perf stat ls

Then WSL tells me

Command 'perf' not found, but can be installed with:
sudo apt install linux-tools-common        # version 6.8.0-38.38, or
sudo apt install linux-laptop-tools-common # version 6.5.0-1004.7

This seems both encouraging and discouraging. Encouraging that it references a standard version of an ubuntu package. Discouraging because the kernel versions listed don’t match my WSL 5.15.131 kernel. The second is not available but the first does install. However, now WSL tells me

WARNING: perf not found for kernel 5.15.153-1-microsoft

You may need to install the following packages for this specific kernel:
   linux-tools-5.15.153.1-microsoft-standard-WSL2
   linux-cloud-tools-5.15.153-1-microsoft-standard-WSL2

You may also want to install one of the following packages to keep up to date:
   linux-tools-standard-WSL2
   linux-cloud-tools-standard-WSL2

None of these packages exist. What I am able to do is install the following package

apt install linux-tools-generic

This gets me the following path

/usr/lib/linux-tools-6.8-39/perf

With these tools, I am able to get some basic counters.

Performance counter stats for 'ls':

              0.66 msec task-clock:u                     #    0.397 CPUs utilized
                 0      context-switches:u               #    0.000 /sec
                 0      cpu-migrations:u                 #    0.000 /sec
                97      page-faults:u                    #  147.148 K/sec
           1113650      cycles:u                         #    1.689 GHz
             44775      stalled-cycles-frontend:u        #    4.02% frontend cycles idle
             85883      stalled-cycles-backend:u         #    7.71% backend cycles idle
            536486      instructions:u                   #    0.48  insn per cycle
                                                  #    0.16  stalled cycles per insn
            109474      branches:u                       #  166.071 M/sec
              6643      branch-misses:u                  #    6.07% of all branches

       0.001661844 seconds time elapsed

       0.000214000 seconds user
       0.000000000 seconds sys

In particular, the output of perf list gives me the following generic events

  branch-instructions OR branches                    [Hardware event]
  branch-misses                                      [Hardware event]
  cache-misses                                       [Hardware event]
  cache-references                                   [Hardware event]
  cpu-cycles OR cycles                               [Hardware event]
  instructions                                       [Hardware event]
  stalled-cycles-backend OR idle-cycles-backend      [Hardware event]
  stalled-cycles-frontend OR idle-cycles-frontend    [Hardware event]
  alignment-faults                                   [Software event]
  bpf-output                                         [Software event]
  cgroup-switches                                    [Software event]
  context-switches OR cs                             [Software event]
  cpu-clock                                          [Software event]
  cpu-migrations OR migrations                       [Software event]
  dummy                                              [Software event]
  emulation-faults                                   [Software event]
  major-faults                                       [Software event]
  minor-faults                                       [Software event]
  page-faults OR faults                              [Software event]
  task-clock                                         [Software event]
  duration_time                                      [Tool event]
  user_time                                          [Tool event]
  system_time                                        [Tool event]

cpu:
  L1-dcache-loads OR cpu/L1-dcache-loads/
  L1-dcache-load-misses OR cpu/L1-dcache-load-misses/
  L1-dcache-prefetches OR cpu/L1-dcache-prefetches/
  L1-icache-loads OR cpu/L1-icache-loads/
  L1-icache-load-misses OR cpu/L1-icache-load-misses/
  dTLB-loads OR cpu/dTLB-loads/
  dTLB-load-misses OR cpu/dTLB-load-misses/
  iTLB-loads OR cpu/iTLB-loads/
  iTLB-load-misses OR cpu/iTLB-load-misses/
  branch-loads OR cpu/branch-loads/
  branch-load-misses OR cpu/branch-load-misses/
  branch-instructions OR cpu/branch-instructions/    [Kernel PMU event]
  branch-misses OR cpu/branch-misses/                [Kernel PMU event]
  cache-misses OR cpu/cache-misses/                  [Kernel PMU event]
  cache-references OR cpu/cache-references/          [Kernel PMU event]
  cpu-cycles OR cpu/cpu-cycles/                      [Kernel PMU event]
  instructions OR cpu/instructions/                  [Kernel PMU event]
  stalled-cycles-backend OR cpu/stalled-cycles-backend/[Kernel PMU event]
  stalled-cycles-frontend OR cpu/stalled-cycles-frontend/[Kernel PMU event]
  msr/tsc/                                           [Kernel PMU event]
  rNNN                                               [Raw hardware event descriptor]
  cpu/t1=v1[,t2=v2,t3 ...]/modifier                  [Raw hardware event descriptor]
       [(see 'man perf-list' on how to encode it)]
  mem:<addr>[/len][:access]                          [Hardware breakpoint]

This is encouraging since it at least shows the more generic hardware events like cycles, instructions and branches. What is missing from this list are counters specific to my Zen5 core such as the topdown performance counters used by wspy to look at microarchitecture differences.

There is one possible way I might get closer to having these counters. This would be to update my WSL kernel/distribution with the following

wsl --update --pre-release

I believe this updates WSL with the following repository: https://github.com/microsoft/WSL/releases At present this is the 2.3.13 release which has a 6.6.36.3 kernel. Unfortunately, according to this phoronix article Zen5 performance events were posted in March 2024. At that time work was underway for a Linux 6.9 kernel. Ubuntu 24.04 shipped with a Linux 6.8 kernel so it is unclear to me if stock Ubuntu 24.04 will support Zen5 topdown counters and the WSL pre-release is even older than that. So at this point, I think I want to try Ubuntu 24.04 first to see what Zen5 counters are available before updating my WSL to a release that might not be new enough.

A step at a time, but this might be sufficient to get some basic Zen5 IPC comparisons with Zen4 even if not the more complete topdown performance counters.

Posted in experiment | Tagged performance counters, wsl, Zen5 | Leave a reply

Creating basic metrics and adding topdown plots

Performance analysis, tools and experiments Posted on December 31, 2023 by mevDecember 31, 2023

I have made several enhancements to the topdown tool. I also have some fragile things I still need to sort out along the way.

  • I have added metrics for –topdown2, –cache2, –float –branch and –opcache. These behave as I expect on AMD systems. I am still sorting out things on Intel system, though something acts strange with my topdown2 counters. If I use them alone, all is well but when I combine them with other counters, the perf_event_open call tells me there is an invalid argument.
  • I have done a first implementation of level 1 caches (–dcache,–icache) and TLB (–tlb). All these use the PERF_TYPE_HW_CACHE type from perf_event_open(2). However, the results don’t quite seem right – so I may look at adding corresponding events with PERF_TYPE_RAW events and see if they make more sense.
  • I did an initial implementation for –memory using the LS core counters for memory operations. This is also used for local/remote memory for likwid. However, the numbers are lower than what stream reports for memory traffic, so not sure this is the right counter recipe. I also have references to the /sys/devices/amd_df counters and can see them after loading the driver. However, not quite sure what counter to use for memory channel read/writes
  • I have created an initial summary block “topdown.txt” for counters that work as I expect and have both for AMD and Intel processors a high level summary I will show below.
  • I have implemented the “–interval” option which lets me sample counters periodically. When combined with gnuplot, –csv and -o options this lets me create some *.png files that plot topdown metrics.

The net combination is best seen below where I include both a topdown metrics summary (created from three runs of “topdown” with different options) and a topdown chart (created from a fourth run with additional options). This is a fair step along the way towards having a basic analysis tool for looking at benchmark loads. In addition to clearing up some of the issues above, I also want to add a “–tree” option to plot a process tree. Once I have that, I’ll have most of the useful bits of the program formerly named “wspy” and might also rename my “topdown” to also accept the “wspy” name.

Here is an AMD summary block with major that includes metrics for coremark:

elapsed              83.410
on_cpu               0.747          # 11.95 / 16 cores
utime                996.029
stime                0.451
nvcsw                1162           # 12.25%
nivcsw               8320           # 87.75%
inblock              0
onblock              1096
cpu-clock            996492501279   # 996.493 seconds
task-clock           996497240698   # 996.497 seconds
page faults          49987          # 50.163/sec
context switches     9695           # 9.729/sec
cpu migrations       136            # 0.136/sec
major page faults    0              # 0.000/sec
minor page faults    49985          # 50.161/sec
alignment faults     0              # 0.000/sec
emulation faults     0              # 0.000/sec
branches             1905721388306  # 189.110 branches per 1000 inst
branch misses        3005711443     # 0.16% branch miss
conditional          1674633740961  # 166.178 conditional branches per 1000 inst
indirect             9422915848     # 0.935 indirect branches per 1000 inst
cpu-cycles           4319923640733  # 3.23 GHz
instructions         10080742579393 # 2.33 IPC
slots                8640874657662  #
retiring             3015427410903  # 34.9% (58.9%)
-- ucode             6726058        #     0.0%
-- fastpath          3015420684845  #    34.9%
frontend             1175050211309  # 13.6% (22.9%)
-- latency           530224174536   #     6.1%
-- bandwidth         644826036773   #     7.5%
backend              894468621667   # 10.4% (17.5%)
-- cpu               270749606784   #     3.1%
-- memory            623719014883   #     7.2%
speculation          36309001429    #  0.4% ( 0.7%)
-- branch mispredict 34321580391    #     0.4%
-- pipeline restart  1987421038     #     0.0%
smt-contention       3519610791947  # 40.7% ( 0.0%)
instructions         5040563575655  # 0.024 l2 access per 1000 inst
l2 hit from l1       114170557      # 8.80% l2 miss
l2 miss from l1      7864844        #
l2 hit from l2 pf    5961997        #
l3 hit from l2 pf    1759222        #
l3 miss from l2 pf   1202870        #
instructions         5036908689193  # 0.085 float per 1000 inst
float 512            92             # 0.000 AVX-512 per 1000 inst
float 256            852            # 0.000 AVX-256 per 1000 inst
float 128            427687605      # 0.085 AVX-128 per 1000 inst
float MMX            0              # 0.000 MMX per 1000 inst
float scalar         0              # 0.000 scalar per 1000 inst

Here is the corresponding Intel summary block, also for coremark:

elapsed              82.626
on_cpu               0.707          # 11.31 / 16 cores
utime                934.350
stime                0.259
nvcsw                1122           # 16.56%
nivcsw               5653           # 83.44%
inblock              0
onblock              1064
cpu-clock            934609836035   # 934.610 seconds
task-clock           934612788300   # 934.613 seconds
page faults          74644          # 79.866/sec
context switches     6966           # 7.453/sec
cpu migrations       190            # 0.203/sec
major page faults    0              # 0.000/sec
minor page faults    74644          # 79.866/sec
alignment faults     0              # 0.000/sec
emulation faults     0              # 0.000/sec
branches             1487191047680  # 189.103 branches per 1000 inst
branch misses        3750608715     # 0.25% branch miss
conditional          1487191057952  # 189.103 conditional branches per 1000 inst
indirect             441335072192   # 56.118 indirect branches per 1000 inst
slots                6076449129938  #
retiring             3906991250131  # 64.3% (64.3%)
-- ucode             67666336195    #     1.1%
-- fastpath          3839324913936  #    63.2%
frontend             1246450345074  # 20.5% (20.5%)
-- latency           751572503238   #    12.4%
-- bandwidth         494877841836   #     8.1%
backend              629022362428   # 10.4% (10.4%)
-- cpu               335343935853   #     5.5%
-- memory            293678426575   #     4.8%
speculation          272715027078   #  4.5% ( 4.5%)
-- branch mispredict 256635566653   #     4.2%
-- pipeline restart  16079460425    #     0.3%
smt-contention       0              #  0.0% ( 0.0%)
cpu-cycles           3907422305230  # 2.65 GHz
instructions         9072449306543  # 2.32 IPC
l2 access            130609511      # 0.029 l2 access per 1000 inst
l2 miss              41959615       # 32.13% l2 miss

Here is the plot file of topdown metrics for coremark followed by the one for stream. From here you can see the repetition with different benchmarks as well as how the overall pattern (backend bound stream, mostly retiring coremark) show together.

Posted in Tools | Tagged gnuplot, performance counters, topdown | Leave a reply

Turning on counters for l3 and data fabric measurements on AMD

Performance analysis, tools and experiments Posted on December 29, 2023 by mevDecember 29, 2023

By default, counters were not available to measure l3 and df counters on AMD. With some help from likwid documentation I figured out what is going on and how to get it enabled. The first thing to do is see … Continue reading →

Posted in experiment | Tagged data fabric, kernel, l3, perf, performance counters | Leave a reply

Potential interface and potential counter groups for topdown tool

Performance analysis, tools and experiments Posted on December 25, 2023 by mevDecember 25, 2023

I have looked through the Family 19h PPR reference, output from “perf list -v –detail” and also some likwid counter groups to figure out combinations of counters I might be able to add as instrumentation options for a topdown command. … Continue reading →

Posted in Tools | Tagged performance counters, topdown | Leave a reply

topdown – updated tool and metrics

Performance analysis, tools and experiments Posted on December 23, 2023 by mevDecember 23, 2023

I have updated and enhanced the topdown tool and also used this as an occasion to explore Zen4 topdown performance counters, Intel hybrid CPU while building something to compare Intel i5-13500H and Ryzen 7940 processor metrics. The interface might change, … Continue reading →

Posted in Tools | Tagged getrusage, perf_event_open, performance counters | Leave a reply

Performance Counters required to compute topdown metrics

Performance analysis, tools and experiments Posted on February 23, 2023 by mevFebruary 23, 2023

From past work, we know the five counters required to compute the first level topdown metrics on Intel processors: CLK_UNHALTED_CORE = 0x00 IDQ_UOPS_NOT_DELIVERED_CORE = 0x9C, umask=1 UOPS_RETIRED_RETIRE_SLOTS = 0xC2, umask=2 UOPS_ISSUED_ANY = 0x0E, umask=1 INT_MISC_RECOVERY_CYCLES = 0x0d, umask=3, cmask=1 These … Continue reading →

Posted in hardware | Tagged perf, performance counters, topdown | Leave a reply

Meta

  • Log in
  • Entries feed
  • Comments feed
  • WordPress.org

Archives

  • November 2024
  • October 2024
  • September 2024
  • July 2024
  • June 2024
  • March 2024
  • February 2024
  • January 2024
  • December 2023
  • February 2023

Tags

7840HS bad data benchmarks cachyos cluster compiler coremark cpu2017 data fabric getrusage gnuplot i5-13500H icache ipc kernel l3 metrics namd opcache perf performance counters perf_event_open phoronix Ryzen AI 9 HX 370 Ryzen AI 365 scaling stream threshold topdown tree virtualization website wsl Zen5

Recent Posts

  • Virtualization comparisons
  • Updating to a new kernel and graphics driver
  • SPEC CPU2017 Ryzen AI HX 370 vs. Ryzen 7840 HS
  • phoronix – Ryzen AI HX 370 vs Ryzen 7840 HS
  • New Ryzen AI 9 HX 370 machine
©2026 - Performance analysis, tools and experiments - Weaver Xtreme Theme
↑